Certificate of Analysis Lookup
Please locate the serial number (abbreviated as "s/n") on your product and use it to reference the tables below.
Most Recent Updates:
- Mar 19, 2026:
- Added specs for next batch of 1,000 and 5,000 IU/drop D3 in EVOO.
- Mar 15, 2026:
- Added specs for next batch of 10 mg/drop K2 MK-4 in EVOO.
- Mar 13, 2026:
- Vitamin K2 MK-4, Received Date: Jul 7, 2025
- 8-month follow up purity: 99.64% (pdf)
- Mar 12, 2026:
- Added specs for next batch of 2 mg/drop K2 MK-4 in EVOO.
- Mar 10, 2026:
- Added specs for next batch of 10,000 mg K2 MK-4 Powder.
- Mar 9, 2026:
- Added COA for next Vitamin K2 MK-4 lot.
- Received Date: Nov 11, 2025
- 1,500 mg K2 MK-4 Powder
- 5 mg/drop K2 MK-4 in EVOO
- Mar 2, 2026:
- Added Vitamin K2 MK-4 10,000 mg specs.
- Feb 24, 2026:
- Added D3 in EVOO 5,000 IU/drop table.
- Vitamin K2 MK-4, Received Date: Feb 22, 2025
- 12-month follow up purity: 100.441% (pdf)
- Feb 19, 2026:
- Updated "made in" specs of bottles to made in India (caps still made in USA) for:
- K2 MK-4 in EVOO, all concentrations (that are marked as made in USA).
- D3 in EVOO, all concentrations (that are marked as made in USA).
- Magnesium Glycinate Powder 100 g.
- Eggshell Calcium Powder 125 g.
- Feb 16, 2026:
- Added new 10 mg/drop K2 MK-4 in EVOOO info.
- Added new 400 g Eggshell Calcium info.
- See all prior updates here.
Shortcut Links:
- Vitamin K2 MK-4
- Vitamin D3 in EVOOO
- Magnesium Glycinate
- Eggshell Calcium
Vitamin K2 MK-4 Powder (1,500 mg)
Serial Numbers (s/n)
& Date Range Sold |
Lab Results & Info |
A0450 - onward
Mar 8, 2026 - onward |
Vitamin K2 MK-4 Powder
- Date received: Nov 11, 2025
- Made in: China (why China?)
- Purity COA (pdf)
- Purity: 99%
- Heavy Metals COA (pdf)
- Aluminum: 0.91 ppm
- Arsenic: < 0.10 ppm
- Cadmium: < 0.10 ppm
- Chromium: 0.49 ppm
- Lead: < 0.10 ppm
- Mercury: < 0.05 ppm
- Nickel: < 0.10 ppm
- Microbials COA (pdf)
- Aerobic Count: < 10 cfu/g
- Coliform Count: < 10 cfu/g
- E. coli Count: < 10 cfu/g
- Salmonella: negative
- Mold: < 10 cfu/g
- Yeast: < 10 cfu/g
Bottle & Cap:
- Bottle material: amber glass
- Cap/seal material: phenolic plastic cap and LDPE cone liner
- Made in: USA
|
A0304 - A0449
Oct 4, 2025 -
Mar 7, 2026 |
Vitamin K2 MK-4 Powder
- Date received: Jul 7, 2025
- Made in: China (why China?)
- Purity COA (pdf)
- Purity: 100%
- 8 month follow up Purity COA (pdf)
- Purity: 99.64%
- Heavy Metals COA (pdf)
- Aluminum: < 0.5 ppm
- Arsenic: < 0.10 ppm
- Cadmium: < 0.10 ppm
- Chromium: 0.25 ppm
- Lead: < 0.10 ppm
- Mercury: < 0.05 ppm
- Nickel: < 0.10 ppm
- Microbials COA (pdf)
- Aerobic Count: < 10 cfu/g
- Coliform Count: < 10 cfu/g
- E. coli Count: < 10 cfu/g
- Salmonella: negative
- Mold: < 10 cfu/g
- Yeast: < 10 cfu/g
Bottle & Cap:
- Bottle material: amber glass
- Cap/seal material: phenolic plastic cap and LDPE cone liner
- Bottle & cap made in: USA
|
A0288 - A0303
Jun 17, 2025 -
Oct 3, 2025 |
Vitamin K2 MK-4 Powder:
- Date received: Feb 22, 2025
- Made in: China (why China?)
- Purity COA (pdf)
- Purity: 100%
- 6 month follow up Purity COA (pdf)
- Purity: 98%
- 12 month follow up Purity COA (pdf)
- Purity: 100.441%
- Heavy Metals COA (pdf)
- Aluminum: < 1.3 ppm
- Arsenic: < 0.50 ppm
- Cadmium: < 0.25 ppm
- Chromium: 6.6 ppm
- Lead: < 0.1 ppm
- Mercury: < 0.10 ppm
- Nickel: < 0.50 ppm
- Microbials COA (pdf)
- Aerobic Count: < 10 cfu/g
- Coliform Count: < 10 cfu/g
- E. coli Count: < 10 cfu/g
- Salmonella: negative
- Mold: < 10 cfu/g
- Yeast: < 10 cfu/g
Bottle & Cap:
- Bottle material: amber glass
- Cap/seal material: phenolic plastic cap and LDPE cone liner
- Bottle & cap made in: USA
|
A0001 - A0287
Aug 8, 2024 -
Jun 16, 2025 |
Vitamin K2 MK-4 Powder:
- Date received: June 28, 2024
- Made in: China (why China?)
- Purity COA (pdf)
- Purity: 110%*1
- 6 month follow up Purity COA (pdf)
- Purity: 99%
- 12 month follow up Purity COA (pdf)
- Purity: 99%
- 18 month follow up Purity COA (pdf)
- Purity: 99.872%
- Purity Certified Standard QC Material COA (pdf)
- Brand: Supelco
- Product: PHR2271
- Lot#: LRAD4558.1
- Purity: 99.9% ±0.1%
- Heavy Metals COA (pdf)
- Aluminum: < 1.2 ppm
- Arsenic: < 0.50 ppm
- Cadmium: < 0.25 ppm
- Chromium: < 0.50 ppm
- Lead: < 0.05 ppm
- Mercury: < 0.10 ppm
- Nickel: < 0.50 ppm
- Microbials COA (pdf, pdf)
- Mold: < 10 cfu/g
- Yeast: < 10 cfu/g
- Aerobic Count:
- Coliform Count: < 10 cfu/g
- E. coli Count: < 10 cfu/g
- Salmonella: negative
- Silica Content COA (pdf)
- Quartz %: <0.2% (below limit)
- Cristobalite %: <0.2% (below limit)
Bottle & Cap:
- Bottle material: amber glass
- Cap/seal material: phenolic plastic cap and LDPE cone liner
- Bottle & cap made in: USA
|
[go back up]
Vitamin K2 MK-4 Powder (10,000 mg)
Serial Numbers (s/n)
& Date Range Sold |
Lab Results & Info |
L0006 - onward
soon |
Vitamin K2 MK-4 Powder
- Date received: Nov 11, 2025
- Made in: China (why China?)
- Purity COA (pdf)
- Purity: 99%
- Heavy Metals COA (pdf)
- Aluminum: 0.91 ppm
- Arsenic: < 0.10 ppm
- Cadmium: < 0.10 ppm
- Chromium: 0.49 ppm
- Lead: < 0.10 ppm
- Mercury: < 0.05 ppm
- Nickel: < 0.10 ppm
- Microbials COA (pdf)
- Aerobic Count: < 10 cfu/g
- Coliform Count: < 10 cfu/g
- E. coli Count: < 10 cfu/g
- Salmonella: negative
- Mold: < 10 cfu/g
- Yeast: < 10 cfu/g
Bottle & Cap:
- Bottle material: amber glass
- Cap/seal material: phenolic plastic cap and LDPE cone liner
- Bottle made in: India
- Cap made in: USA
|
L0001 - L0005
Mar 2, 2026 - onward |
Vitamin K2 MK-4 Powder
- Date received: Jul 7, 2025
- Made in: China (why China?)
- Purity COA (pdf)
- Purity: 100%
- 8 month follow up Purity COA (pdf)
- Purity: 99.64%
- Heavy Metals COA (pdf)
- Aluminum: < 0.5 ppm
- Arsenic: < 0.10 ppm
- Cadmium: < 0.10 ppm
- Chromium: 0.25 ppm
- Lead: < 0.10 ppm
- Mercury: < 0.05 ppm
- Nickel: < 0.10 ppm
- Microbials COA (pdf)
- Aerobic Count: < 10 cfu/g
- Coliform Count: < 10 cfu/g
- E. coli Count: < 10 cfu/g
- Salmonella: negative
- Mold: < 10 cfu/g
- Yeast: < 10 cfu/g
Bottle & Cap:
- Bottle material: amber glass
- Cap/seal material: phenolic plastic cap and LDPE cone liner
- Bottle made in: India
- Cap made in: USA
|
[go back up]
Vitamin K2 MK-4 in EVOO(O) ~2 mg/drop, 860 drops
Serial Numbers (s/n)
& Date Range Sold |
Lab Results & Info |
B1245 - onward
soon |
Vitamin K2 MK-4 Powder
- Date received: Nov 11, 2025
- Made in: China (why China?)
- Purity COA (pdf)
- Purity: 99%
- Heavy Metals COA (pdf)
- Aluminum: 0.91 ppm
- Arsenic: < 0.10 ppm
- Cadmium: < 0.10 ppm
- Chromium: 0.49 ppm
- Lead: < 0.10 ppm
- Mercury: < 0.05 ppm
- Nickel: < 0.10 ppm
- Microbials COA (pdf)
- Aerobic Count: < 10 cfu/g
- Coliform Count: < 10 cfu/g
- E. coli Count: < 10 cfu/g
- Salmonella: negative
- Mold: < 10 cfu/g
- Yeast: < 10 cfu/g
Bottle, Cap & Dropper:
- Bottle material: amber glass
- Cap/bulb material: plastic, monprene TPE
- Dropper material: glass
- Bottle made in: India
- Dropper cap made in: USA
|
B1212 - B1244
Mar 12, 2026 - onward
|
Vitamin K2 MK-4 Powder:
- Date received: Jul 7, 2025
- Made in: China (why China?)
- Purity COA (pdf)
- Purity: 100%
- 8 month follow up Purity COA (pdf)
- Purity: 99.64%
- Heavy Metals COA (pdf)
- Aluminum: < 0.5 ppm
- Arsenic: < 0.10 ppm
- Cadmium: < 0.10 ppm
- Chromium: 0.25 ppm
- Lead: < 0.10 ppm
- Mercury: < 0.05 ppm
- Nickel: < 0.10 ppm
- Microbials COA (pdf)
- Aerobic Count: 10 cfu/g
- Coliform Count: < 10 cfu/g
- E. coli Count: < 10 cfu/g
- Salmonella: negative
- Mold: < 10 cfu/g
- Yeast: < 10 cfu/g
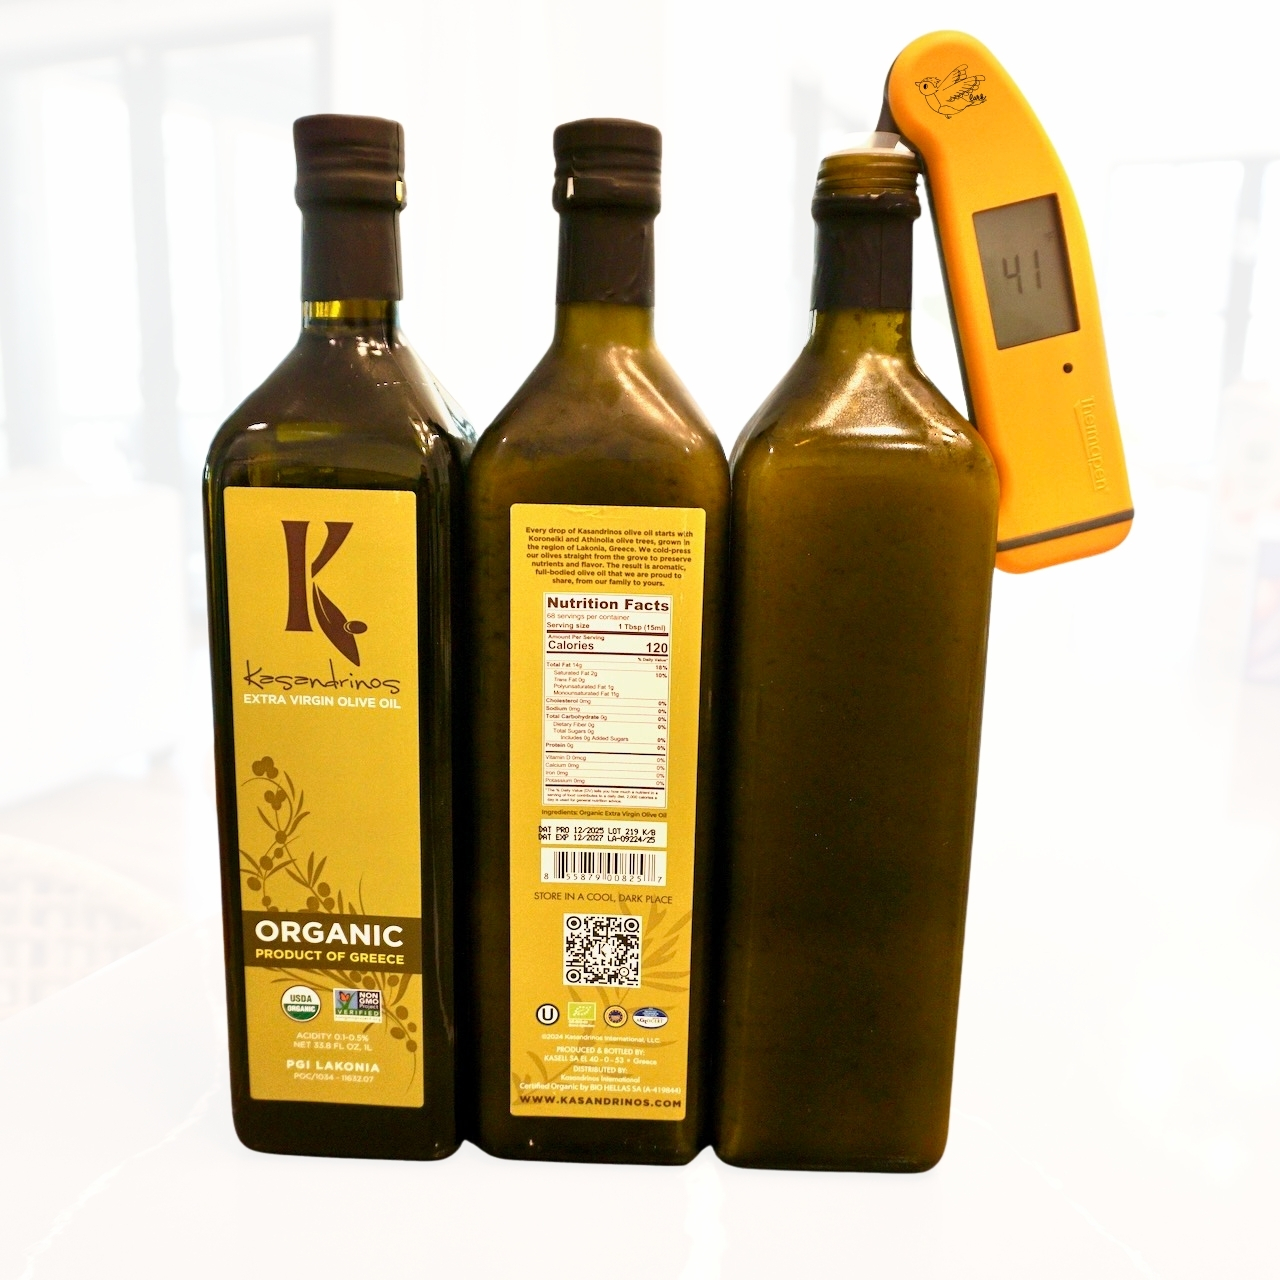
Extra Virgin Olive Oil, Organic:
- Image (jpg)
- Brand: Kasandrinos
- Made in: Greece
- Lot #: 219 K/B
- Production: 12/2025
- Expiration: 12/2027
- Turns solid in fridge?: Yes (jpg)
Bottle, Cap & Dropper:
- Bottle material: amber glass
- Cap/bulb material: plastic, monprene TPE
- Dropper material: glass
- Bottle made in: India
- Dropper cap made in: USA
|
B1051 - B1211
Jan 27, 2026 -
Mar 11, 2026 |
Vitamin K2 MK-4 Powder:
- Date received: Jul 7, 2025
- Made in: China (why China?)
- Purity COA (pdf)
- Purity: 100%
- 8 month follow up Purity COA (pdf)
- Purity: 99.64%
- Heavy Metals COA (pdf)
- Aluminum: < 0.5 ppm
- Arsenic: < 0.10 ppm
- Cadmium: < 0.10 ppm
- Chromium: 0.25 ppm
- Lead: < 0.10 ppm
- Mercury: < 0.05 ppm
- Nickel: < 0.10 ppm
- Microbials COA (pdf)
- Aerobic Count: 10 cfu/g
- Coliform Count: < 10 cfu/g
- E. coli Count: < 10 cfu/g
- Salmonella: negative
- Mold: < 10 cfu/g
- Yeast: < 10 cfu/g
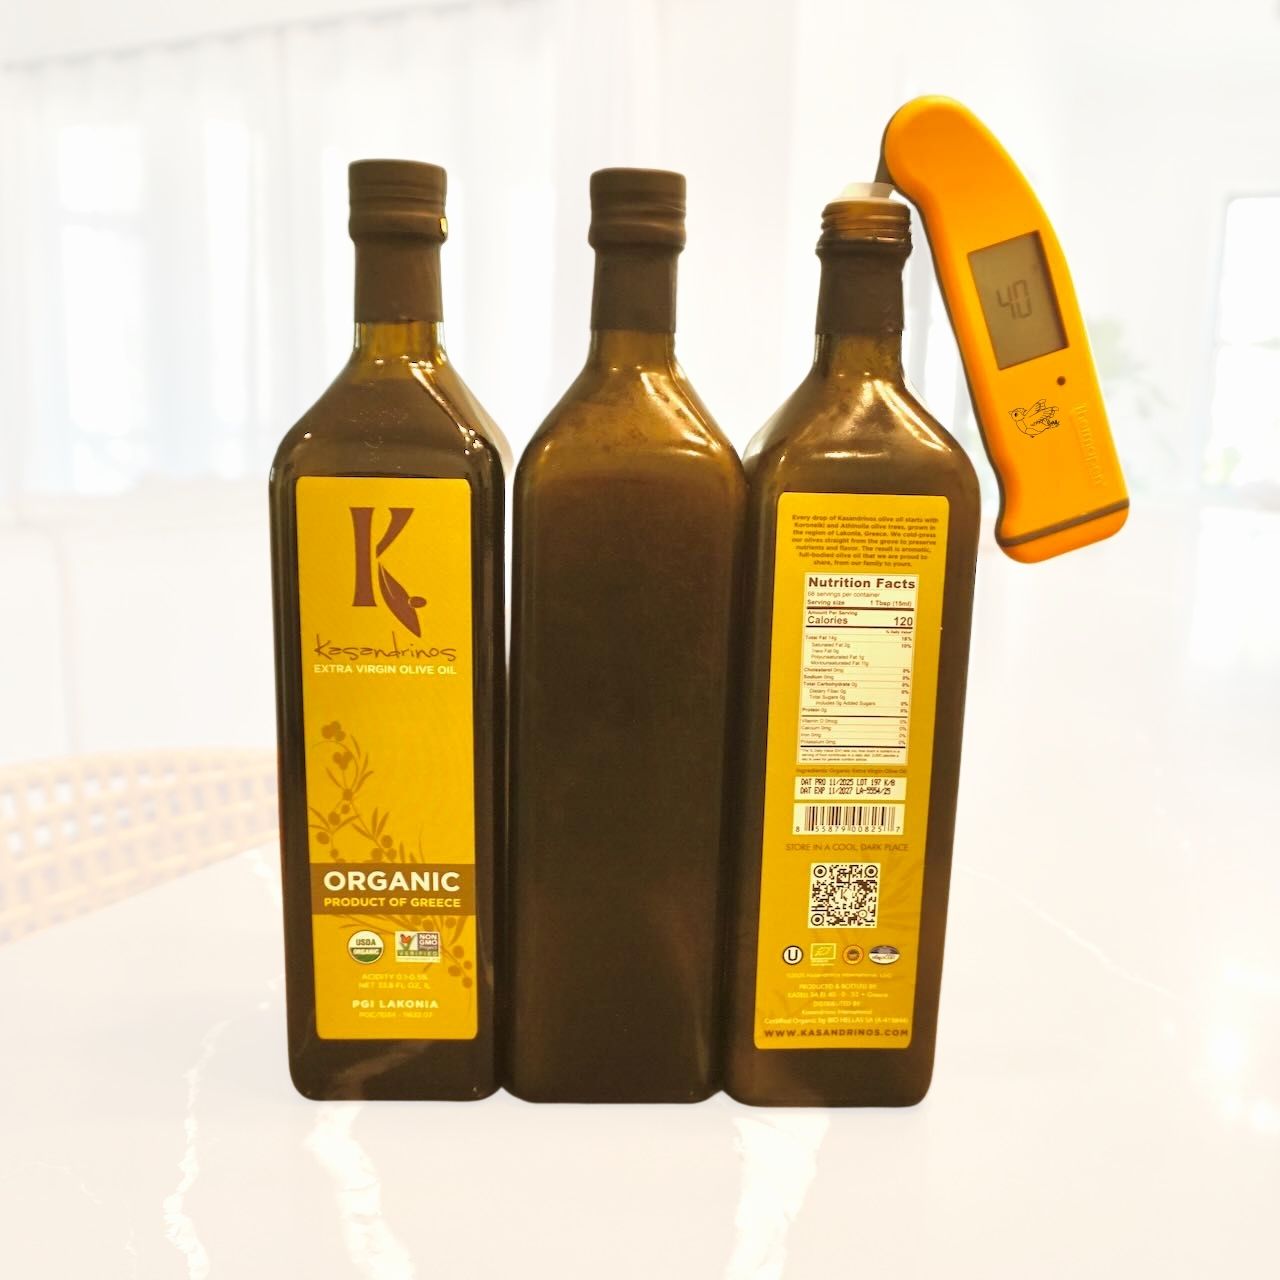
Extra Virgin Olive Oil, Organic:
- Image (jpg)
- Brand: Kasandrinos
- Made in: Greece
- Lot #: 197 K/B
- Production: 11/2025
- Expiration: 11/2027
- Turns solid in fridge?: Yes (jpg)
Bottle, Cap & Dropper:
- Bottle material: amber glass
- Cap/bulb material: plastic, monprene TPE
- Dropper material: glass
- Bottle made in: India
- Dropper cap made in: USA
|
B0924 - B1050
Dec 30, 2025 -
Jan 27, 2026 |
Vitamin K2 MK-4 Powder:
- Date received: Jul 7, 2025
- Made in: China (why China?)
- Purity COA (pdf)
- Purity: 100%
- 8 month follow up Purity COA (pdf)
- Purity: 99.64%
- Heavy Metals COA (pdf)
- Aluminum: < 0.5 ppm
- Arsenic: < 0.10 ppm
- Cadmium: < 0.10 ppm
- Chromium: 0.25 ppm
- Lead: < 0.10 ppm
- Mercury: < 0.05 ppm
- Nickel: < 0.10 ppm
- Microbials COA (pdf)
- Aerobic Count: 10 cfu/g
- Coliform Count: < 10 cfu/g
- E. coli Count: < 10 cfu/g
- Salmonella: negative
- Mold: < 10 cfu/g
- Yeast: < 10 cfu/g
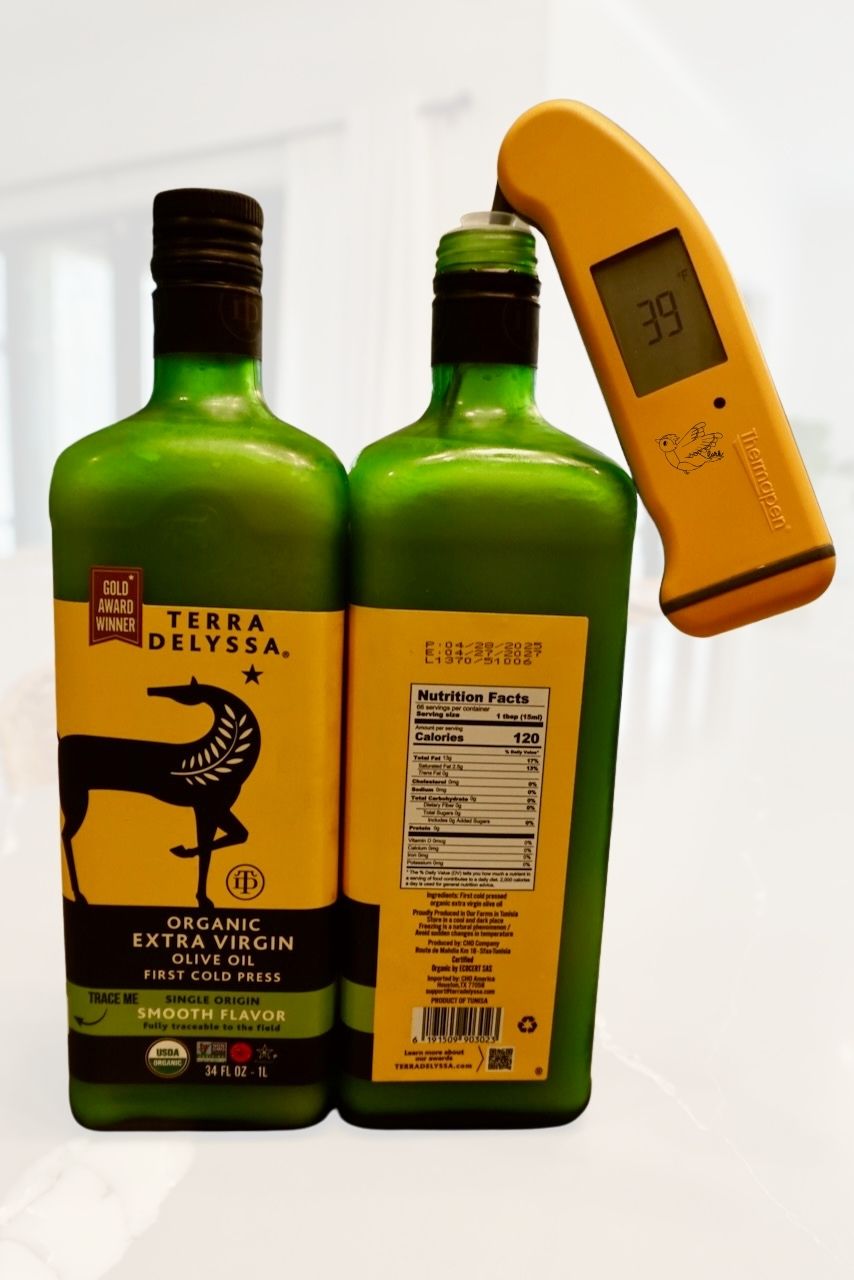
Extra Virgin Olive Oil, Organic:
- Image (jpg)
- Brand: Terra Delyssa
- Made in: Tunisia
- Lot #: L1370/51006
- Production: 04/28/2025
- Expiration: 04/27/2027
- Turns solid in fridge?: Yes (jpg)
Bottle, Cap & Dropper:
- Bottle material: amber glass
- Cap/bulb material: plastic, monprene TPE
- Dropper material: glass
- Bottle made in: India
- Dropper cap made in: USA
|
B0791 - B0923
Nov 18, 2025 -
Dec 30, 2025
|
Vitamin K2 MK-4 Powder:
- Date received: Jul 7, 2025
- Made in: China (why China?)
- Purity COA (pdf)
- Purity: 100%
- 8 month follow up Purity COA (pdf)
- Purity: 99.64%
- Heavy Metals COA (pdf)
- Aluminum: < 0.5 ppm
- Arsenic: < 0.10 ppm
- Cadmium: < 0.10 ppm
- Chromium: 0.25 ppm
- Lead: < 0.10 ppm
- Mercury: < 0.05 ppm
- Nickel: < 0.10 ppm
- Microbials COA (pdf)
- Aerobic Count: 10 cfu/g
- Coliform Count: < 10 cfu/g
- E. coli Count: < 10 cfu/g
- Salmonella: negative
- Mold: < 10 cfu/g
- Yeast: < 10 cfu/g
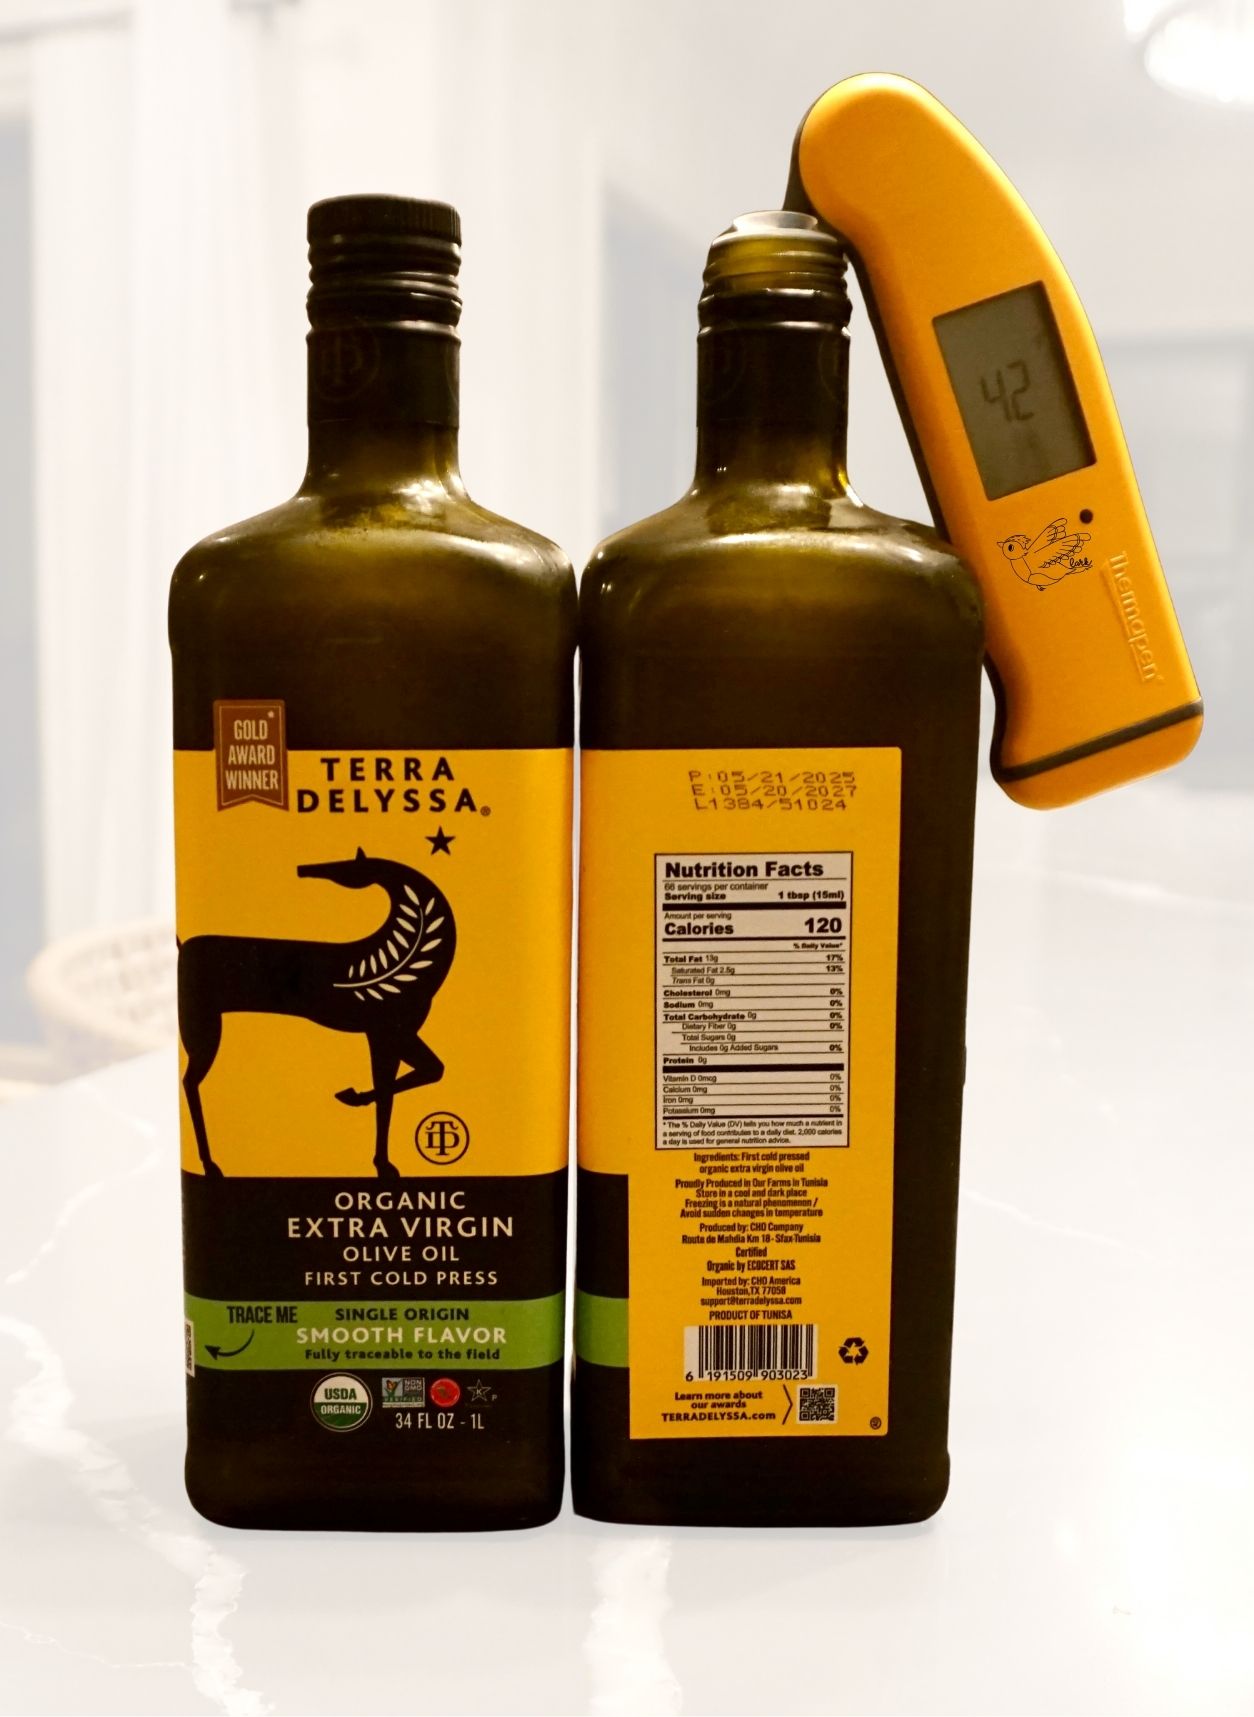
Extra Virgin Olive Oil, Organic:
- Image (jpg)
- Brand: Terra Delyssa
- Made in: Tunisia
- Lot #: L1384/51024
- Production: 05/21/2025
- Expiration: 05/20/2027
- Turns solid in fridge?: Yes (jpg)
Bottle, Cap & Dropper:
- Bottle material: amber glass
- Cap/bulb material: plastic, monprene TPE
- Dropper material: glass
- Bottle made in: India
- Dropper cap made in: USA
|
B0651 - B0790
Sep 19, 2025 -
Nov 18, 2025 |
Vitamin K2 MK-4 Powder:
- Date received: Jul 7, 2025
- Made in: China (why China?)
- Purity COA (pdf)
- Purity: 100%
- 8 month follow up Purity COA (pdf)
- Purity: 99.64%
- Heavy Metals COA (pdf)
- Aluminum: < 0.5 ppm
- Arsenic: < 0.10 ppm
- Cadmium: < 0.10 ppm
- Chromium: 0.25 ppm
- Lead: < 0.10 ppm
- Mercury: < 0.05 ppm
- Nickel: < 0.10 ppm
- Microbials COA (pdf)
- Aerobic Count: 10 cfu/g
- Coliform Count: < 10 cfu/g
- E. coli Count: < 10 cfu/g
- Salmonella: negative
- Mold: < 10 cfu/g
- Yeast: < 10 cfu/g
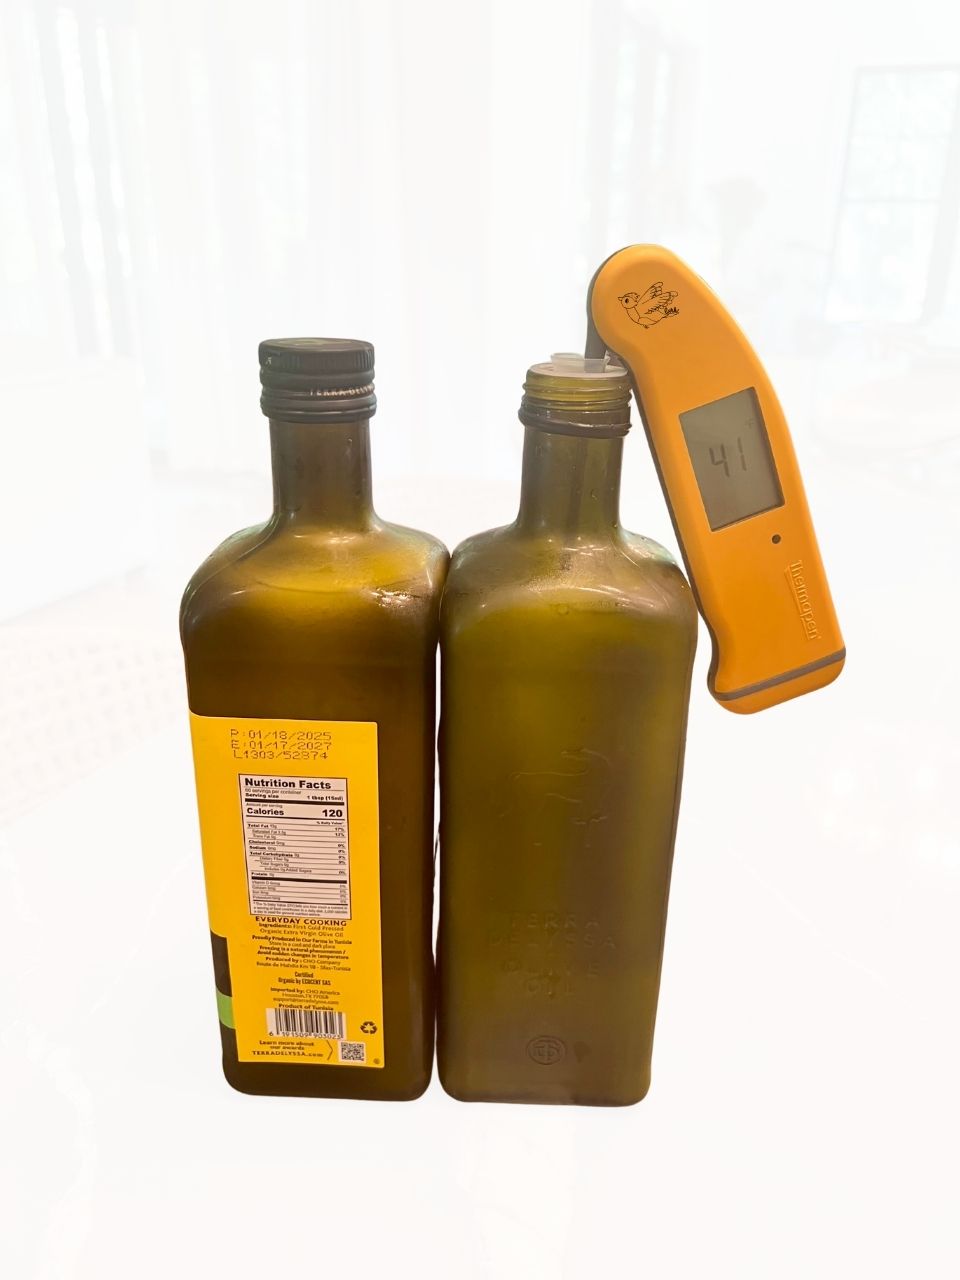
Extra Virgin Olive Oil, Organic:
- Image (jpg)
- Brand: Terra Delyssa
- Made in: Tunisia
- Lot #: L1303/52874
- Production: 01/18/2025
- Expiration: 01/17/2027
- Turns solid in fridge?: Yes (jpg)
Bottle, Cap & Dropper:
- Bottle material: amber glass
- Cap/bulb material: plastic, monprene TPE
- Dropper material: glass
- Bottle made in: India
- Dropper cap made in: USA
|
B0606 - B0651
Aug 26, 2025 -
Sep 18, 2025 |
Vitamin K2 MK-4 Powder:
- Date received: Jul 7, 2025
- Made in: China (why China?)
- Purity COA (pdf)
- Purity: 100%
- 8 month follow up Purity COA (pdf)
- Purity: 99.64%
- Heavy Metals COA (pdf)
- Aluminum: < 0.5 ppm
- Arsenic: < 0.10 ppm
- Cadmium: < 0.10 ppm
- Chromium: 0.25 ppm
- Lead: < 0.10 ppm
- Mercury: < 0.05 ppm
- Nickel: < 0.10 ppm
- Microbials COA (pdf)
- Aerobic Count: 10 cfu/g
- Coliform Count: < 10 cfu/g
- E. coli Count: < 10 cfu/g
- Salmonella: negative
- Mold: < 10 cfu/g
- Yeast: < 10 cfu/g
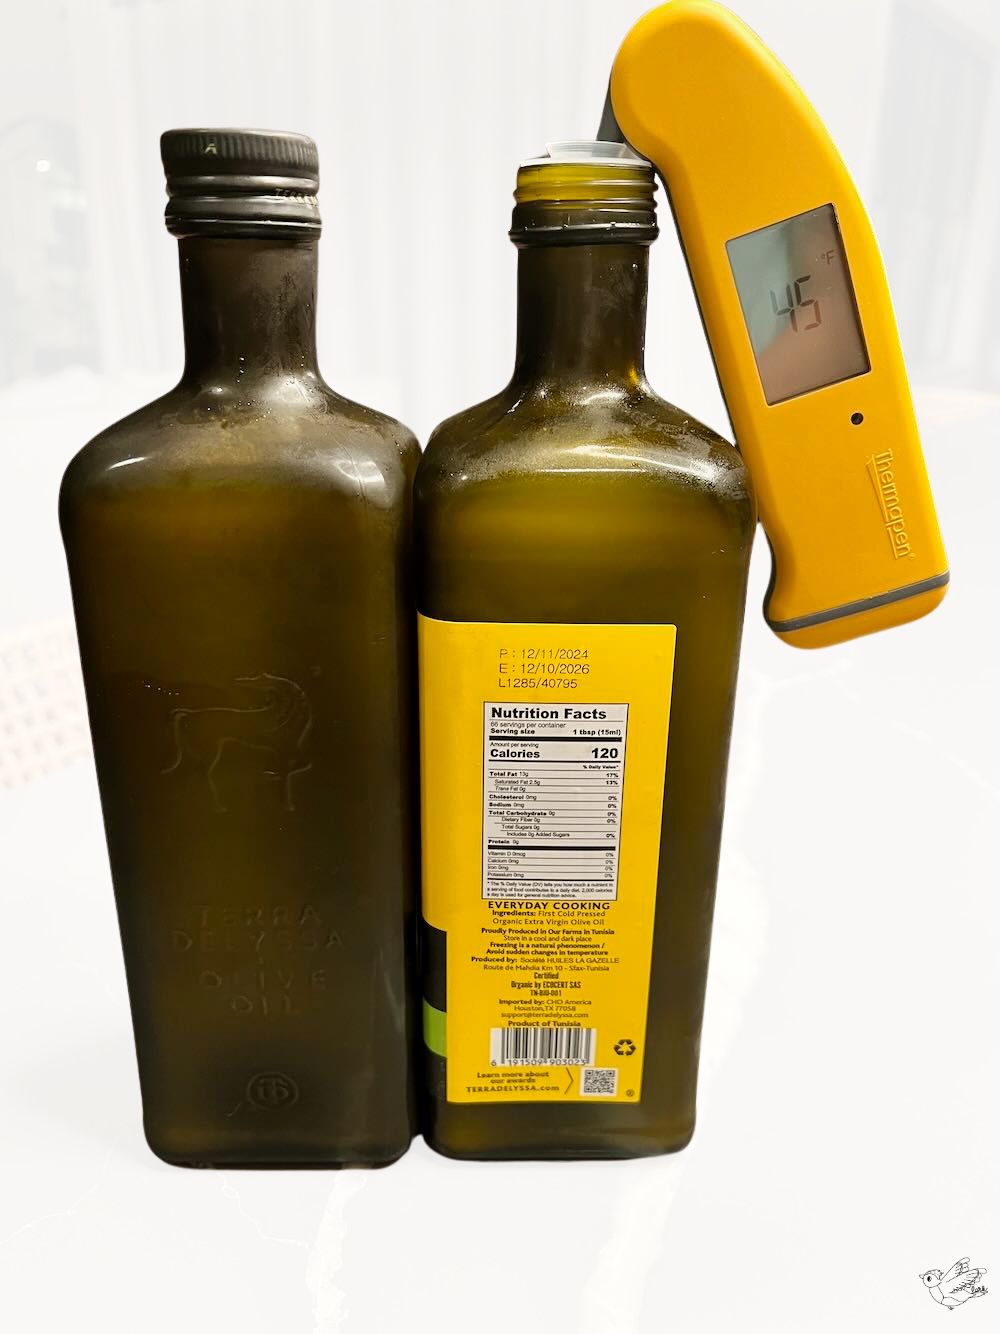
Extra Virgin Olive Oil, Organic:
- Image (jpg)
- Brand: Terra Delyssa
- Made in: Tunisia
- Lot #: L1285/40795
- Production: 12/11/2024
- Expiration: 12/10/2026
- Turns solid in fridge?: Yes (jpg)
Bottle, Cap & Dropper:
- Bottle material: amber glass
- Cap/bulb material: plastic, monprene TPE
- Dropper material: glass
- Bottle made in: India
- Dropper cap made in: USA
|
B0555 - B0605
Aug 1, 2025 -
Aug 26, 2025 |
Vitamin K2 MK-4 Powder:
- Date received: Feb 22, 2025
- Made in: China (why China?)
- Purity COA (pdf)
- Purity: 100%
- 6 month follow up Purity COA (pdf)
- Purity: 98%
- 12 month follow up Purity COA (pdf)
- Purity: 100.441%
- Heavy Metals COA (pdf)
- Aluminum: < 1.3 ppm
- Arsenic: < 0.50 ppm
- Cadmium: < 0.25 ppm
- Chromium: 6.6 ppm
- Lead: < 0.10 ppm
- Mercury: < 0.10 ppm
- Nickel: < 0.50 ppm
- Microbials COA (pdf)
- Aerobic Count: < 10 cfu/g
- Coliform Count: < 10 cfu/g
- E. coli Count: < 10 cfu/g
- Salmonella: negative
- Mold: < 10 cfu/g
- Yeast: < 10 cfu/g
Extra Virgin Olive Oil, Organic:
- Image (jpg)
- Brand: Terra Delyssa
- Made in: Tunisia
- Lot #: L1285/40795
- Production: 12/11/2024
- Expiration: 12/10/2026
- Turns solid in fridge?: Yes (jpg)
Bottle, Cap & Dropper:
- Bottle material: amber glass
- Cap/bulb material: plastic, monprene TPE
- Dropper material: glass
- Bottle made in: India
- Dropper cap made in: USA
|
B0464 - B0554
Jun 20, 2025 -
Jul 30, 2025 |
Vitamin K2 MK-4 Powder:
- Date received: Feb 22, 2025
- Made in: China (why China?)
- Purity COA (pdf)
- Purity: 100%
- 6 month follow up Purity COA (pdf)
- Purity: 98%
- 12 month follow up Purity COA (pdf)
- Purity: 100.441%
- Heavy Metals COA (pdf)
- Aluminum: < 1.3 ppm
- Arsenic: < 0.50 ppm
- Cadmium: < 0.25 ppm
- Chromium: 6.6 ppm
- Lead: < 0.10 ppm
- Mercury: < 0.10 ppm
- Nickel: < 0.50 ppm
- Microbials COA (pdf)
- Aerobic Count: < 10 cfu/g
- Coliform Count: < 10 cfu/g
- E. coli Count: < 10 cfu/g
- Salmonella: negative
- Mold: < 10 cfu/g
- Yeast: < 10 cfu/g
Extra Virgin Olive Oil, Organic:
- Image (jpg)
- Brand: Terra Delyssa
- Made in: Tunisia
- Lot #: L1285/40795
- Production: 12/11/2024
- Expiration: 12/10/2026
- Turns solid in fridge?: Yes (jpg)
Bottle, Cap & Dropper:
- Bottle material: amber glass
- Cap/bulb material: plastic and rubber
- Dropper material: glass
- Bottle and dropper cap made in: China (why China?)
|
B0337 - B0463
Apr 30, 2025 -
Jun 20, 2025 |
Vitamin K2 MK-4 Powder:
- Date received: Feb 22, 2025
- Made in: China (why China?)
- Purity COA (pdf)
- Purity: 100%
- 6 month follow up Purity COA (pdf)
- Purity: 98%
- 12 month follow up Purity COA (pdf)
- Purity: 100.441%
- Heavy Metals COA (pdf)
- Aluminum: < 1.3 ppm
- Arsenic: < 0.50 ppm
- Cadmium: < 0.25 ppm
- Chromium: 6.6 ppm
- Lead: < 0.10 ppm
- Mercury: < 0.10 ppm
- Nickel: < 0.50 ppm
- Microbials COA (pdf)
- Aerobic Count: < 10 cfu/g
- Coliform Count: < 10 cfu/g
- E. coli Count: < 10 cfu/g
- Salmonella: negative
- Mold: < 10 cfu/g
- Yeast: < 10 cfu/g
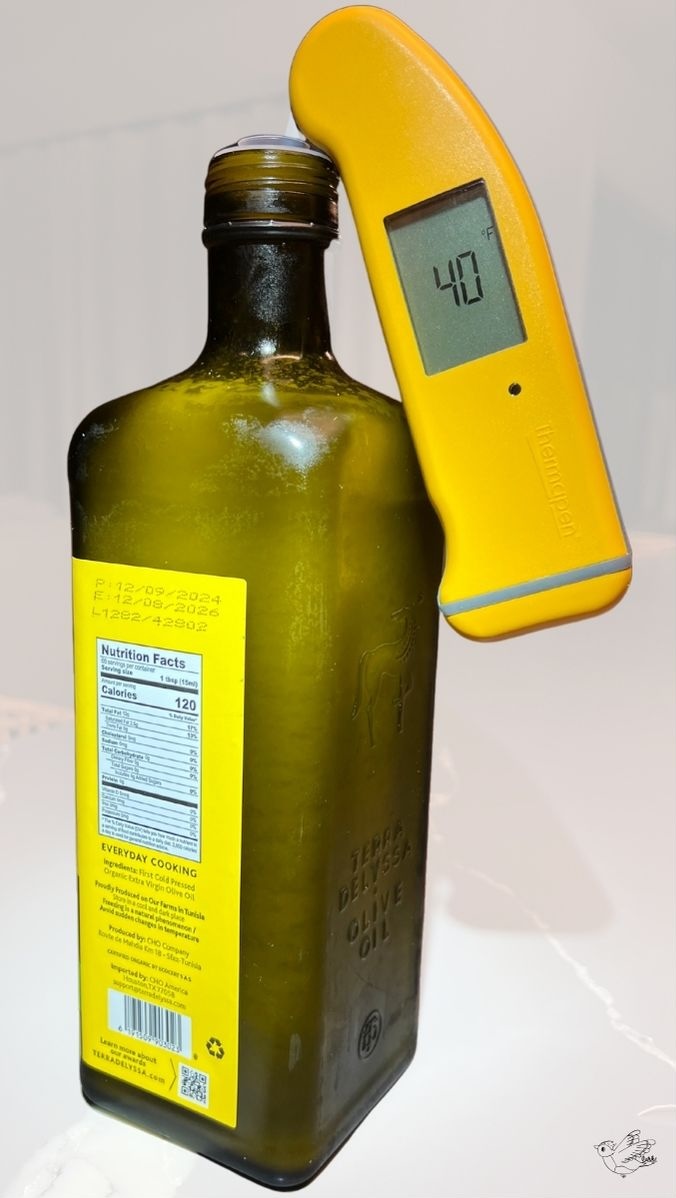
Extra Virgin Olive Oil, Organic:
- Image (jpg)
- Brand: Terra Delyssa
- Made in: Tunisia
- Lot #: L1282/42802
- Production: 12/09/2024
- Expiration: 12/08/2026
- Turns solid in fridge?: Yes (jpg)
Bottle, Cap & Dropper:
- Bottle material: amber glass
- Cap/bulb material: plastic and rubber
- Dropper material: glass
- Bottle and dropper cap made in: China (why China?)
|
B0271 - B0336
Apr 11, 2025 -
Apr 30, 2025 |
Vitamin K2 MK-4 Powder:
- Date received: Feb 22, 2025
- Made in: China (why China?)
- Purity COA (pdf)
- Purity: 100%
- 6 month follow up Purity COA (pdf)
- Purity: 98%
- 12 month follow up Purity COA (pdf)
- Purity: 100.441%
- Heavy Metals COA (pdf)
- Aluminum: < 1.3 ppm
- Arsenic: < 0.50 ppm
- Cadmium: < 0.25 ppm
- Chromium: 6.6 ppm
- Lead: < 0.10 ppm
- Mercury: < 0.10 ppm
- Nickel: < 0.50 ppm
- Microbials COA (pdf)
- Aerobic Count: < 10 cfu/g
- Coliform Count: < 10 cfu/g
- E. coli Count: < 10 cfu/g
- Salmonella: negative
- Mold: < 10 cfu/g
- Yeast: < 10 cfu/g
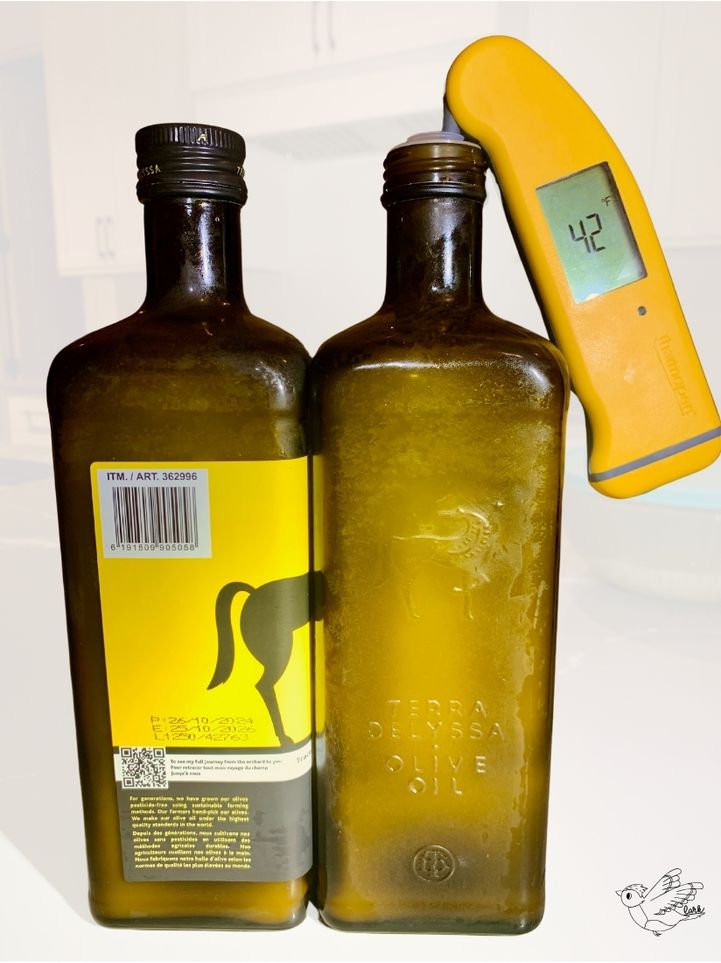
Extra Virgin Olive Oil, Organic:
- Image (jpg)
- Brand: Terra Delyssa
- Made in: Tunisia
- Lot #: L1250/42763
- Use by: 25/10/2026
- Turns solid in fridge?: Yes (jpg)
Bottle, Cap & Dropper:
- Bottle material: amber glass
- Cap/bulb material: plastic and rubber
- Dropper material: glass
- Bottle and dropper cap made in: China (why China?)
|
B0055 - B0270
Jan 27, 2025 -
Apr 10, 2025 |
Vitamin K2 MK-4 Powder:
- Date received: June 28, 2024
- Made in: China (why China?)
- Purity Certified Standard QC Material COA (pdf)
- Brand: Supelco
- Product: PHR2271
- Lot#: LRAD4558.1
- Purity: 99.9% ±0.1%
- 6 month follow up Purity COA (pdf)
- Purity: 99%
- 12 month follow up Purity COA (pdf)
- Purity: 99%
- 18 month follow up Purity COA (pdf)
- Purity: 99.872%
- Purity Certified Standard QC Material COA (pdf)
- Brand: Supelco
- Product: PHR2271
- Lot#: LRAD4558.1
- Purity: 99.9% ±0.1%
- Heavy Metals COA (pdf)
- Aluminum: < 1.2 ppm
- Arsenic: < 0.50 ppm
- Cadmium: < 0.25 ppm
- Chromium: < 0.50 ppm
- Lead: < 0.05 ppm
- Mercury: < 0.10 ppm
- Nickel: < 0.50 ppm
- Microbials COA (pdf, pdf)
- Mold: < 10 cfu/g
- Yeast: < 10 cfu/g
- Aerobic Count:
- Coliform Count: < 10 cfu/g
- E. coli Count: < 10 cfu/g
- Salmonella: negative
- Silica Content COA (pdf)
- Quartz %: <0.2% (below lab detectable limit)
- Cristobalite %: <0.2% (below lab detectable limit)
Extra Virgin Olive Oil, Organic:
- Image (jpg)
- Brand: Terra Delyssa
- Made in: Tunisia
- Lot #: L1250/42763
- Use by: 25/10/2026
- Turns solid in fridge?: Yes (jpg)
Bottle, Cap & Dropper:
- Bottle material: amber glass
- Cap/bulb material: plastic, monprene TPE
- Dropper material: glass
- Bottle made in: India
- Dropper cap made in: USA
|
B0001 - B0054
Dec 17, 2024 -
Jan 24, 2025 |
Vitamin K2 MK-4 Powder:
- Date received: June 28, 2024
- Made in: China (why China?)
- Purity Certified Standard QC Material COA (pdf)
- Brand: Supelco
- Product: PHR2271
- Lot#: LRAD4558.1
- Purity: 99.9% ±0.1%
- 6 month follow up Purity COA (pdf)
- Purity: 99%
- 12 month follow up Purity COA (pdf)
- Purity: 99%
- 18 month follow up Purity COA (pdf)
- Purity: 99.872%
- Heavy Metals COA (pdf)
- Aluminum: < 1.2 ppm
- Arsenic: < 0.50 ppm
- Cadmium: < 0.25 ppm
- Chromium: < 0.50 ppm
- Lead: < 0.05 ppm
- Mercury: < 0.10 ppm
- Nickel: < 0.50 ppm
- Microbials COA (pdf, pdf)
- Mold: < 10 cfu/g
- Yeast: < 10 cfu/g
- Aerobic Count:
- Coliform Count: < 10 cfu/g
- E. coli Count: < 10 cfu/g
- Salmonella: negative
- Silica Content COA (pdf)
- Quartz %: <0.2% (below lab detectable limit)
- Cristobalite %: <0.2% (below lab detectable limit)
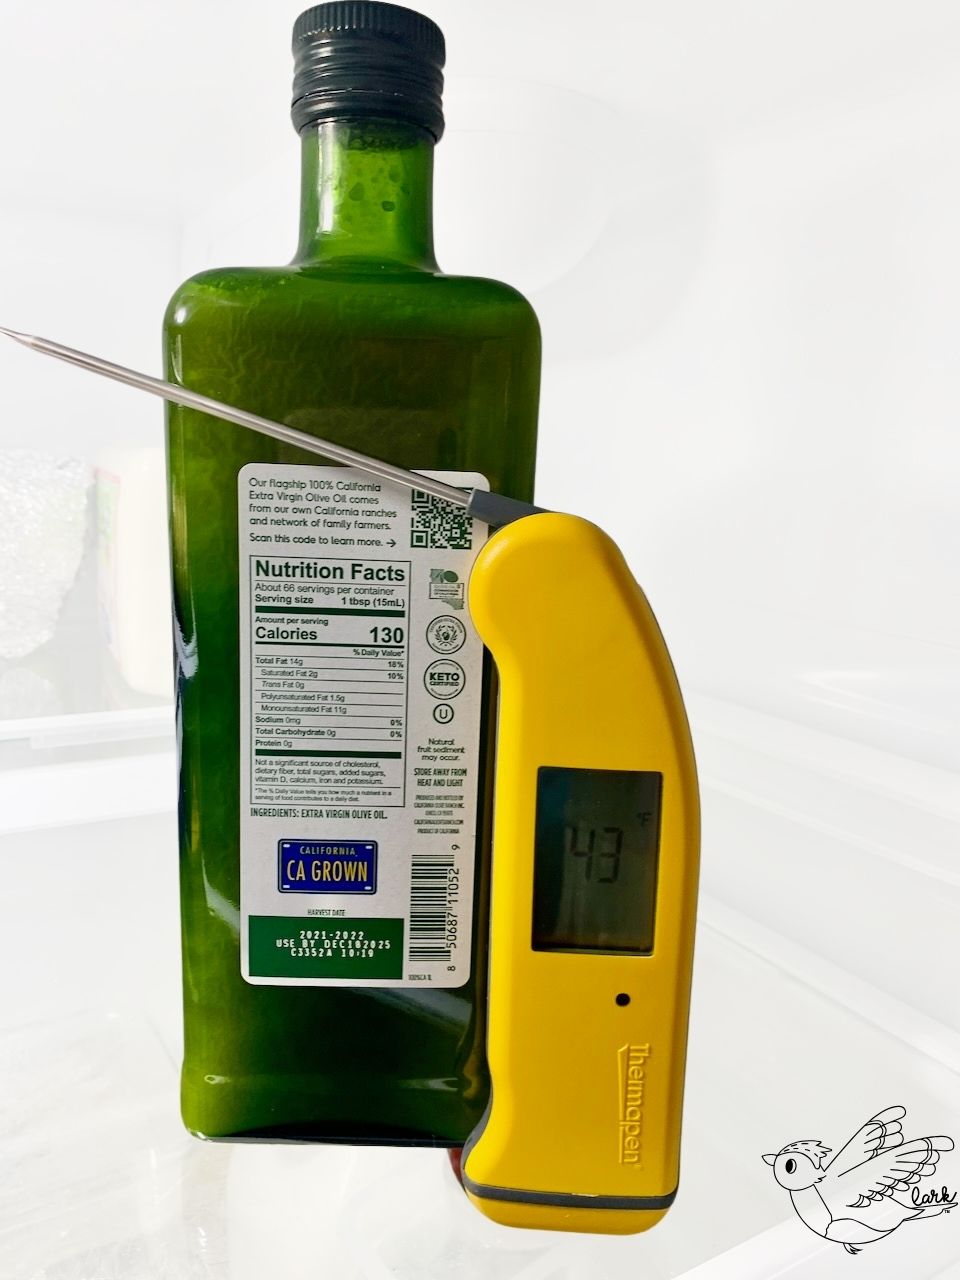
Extra Virgin Olive Oil:
- Image (jpg)
- Brand: California Olive Ranch
- Made in: USA
- Lot #: C3352A
- Use by: DEC182025
- Turns solid in fridge?: Yes (jpg)
Bottle, Cap & Dropper:
- Bottle material: amber glass
- Cap/bulb material: plastic, monprene TPE
- Dropper material: glass
- Bottle made in: India
- Dropper cap made in: USA
|
[go back up]
Vitamin K2 MK-4 in EVOO(O) ~5 mg/drop, 860 drops
Serial Numbers (s/n)
& Date Range Sold |
Lab Results & Info |
J0082 - onward
Mar 9, 2026 - onward |
Vitamin K2 MK-4 Powder
- Date received: Nov 11, 2025
- Made in: China (why China?)
- Purity COA (pdf)
- Purity: 99%
- Heavy Metals COA (pdf)
- Aluminum: 0.91 ppm
- Arsenic: < 0.10 ppm
- Cadmium: < 0.10 ppm
- Chromium: 0.49 ppm
- Lead: < 0.10 ppm
- Mercury: < 0.05 ppm
- Nickel: < 0.10 ppm
- Microbials COA (pdf)
- Aerobic Count: < 10 cfu/g
- Coliform Count: < 10 cfu/g
- E. coli Count: < 10 cfu/g
- Salmonella: negative
- Mold: < 10 cfu/g
- Yeast: < 10 cfu/g
Extra Virgin Olive Oil, Organic:
- Image (jpg)
- Brand: Kasandrinos
- Made in: Greece
- Lot #: 219 K/B
- Production: 12/2025
- Expiration: 12/2027
- Turns solid in fridge?: Yes (jpg)
Bottle, Cap & Dropper:
- Bottle material: amber glass
- Cap/bulb material: plastic, monprene TPE
- Dropper material: glass
- Bottle made in: India
- Dropper cap made in: USA
|
J0001 - J0081
Jan 22, 2026 -
Mar 8, 2026 |
Vitamin K2 MK-4 Powder:
- Date received: Jul 7, 2025
- Made in: China (why China?)
- Purity COA (pdf)
- Purity: 100%
- 8 month follow up Purity COA (pdf)
- Purity: 99.64%
- Heavy Metals COA (pdf)
- Aluminum: < 0.5 ppm
- Arsenic: < 0.10 ppm
- Cadmium: < 0.10 ppm
- Chromium: 0.25 ppm
- Lead: < 0.10 ppm
- Mercury: < 0.05 ppm
- Nickel: < 0.10 ppm
- Microbials COA (pdf)
- Aerobic Count: 10 cfu/g
- Coliform Count: < 10 cfu/g
- E. coli Count: < 10 cfu/g
- Salmonella: negative
- Mold: < 10 cfu/g
- Yeast: < 10 cfu/g
Extra Virgin Olive Oil, Organic:
- Image (jpg)
- Brand: Kasandrinos
- Made in: Greece
- Lot #: 197 K/B
- Production: 11/2025
- Expiration: 11/2027
- Turns solid in fridge?: Yes (jpg)
Bottle, Cap & Dropper:
- Bottle material: amber glass
- Cap/bulb material: plastic, monprene TPE
- Dropper material: glass
- Bottle made in: India
- Dropper cap made in: USA
|
[go back up]
Vitamin K2 MK-4 in EVOO(O) ~10 mg/drop, 860 drops
Serial Numbers (s/n)
& Date Range Sold |
Lab Results & Info |
C0129 - onward
soon |
Vitamin K2 MK-4 Powder
- Date received: Nov 11, 2025
- Made in: China (why China?)
- Purity COA (pdf)
- Purity: 99%
- Heavy Metals COA (pdf)
- Aluminum: 0.91 ppm
- Arsenic: < 0.10 ppm
- Cadmium: < 0.10 ppm
- Chromium: 0.49 ppm
- Lead: < 0.10 ppm
- Mercury: < 0.05 ppm
- Nickel: < 0.10 ppm
- Microbials COA (pdf)
- Aerobic Count: < 10 cfu/g
- Coliform Count: < 10 cfu/g
- E. coli Count: < 10 cfu/g
- Salmonella: negative
- Mold: < 10 cfu/g
- Yeast: < 10 cfu/g
Extra Virgin Olive Oil, Organic:
- Image (jpg)
- Brand: Kasandrinos
- Made in: Greece
- Lot #: 219 K/B
- Production: 12/2025
- Expiration: 12/2027
- Turns solid in fridge?: Yes (jpg)
Bottle, Cap & Dropper:
- Bottle material: amber glass
- Cap/bulb material: plastic, monprene TPE
- Dropper material: glass
- Bottle made in: India
- Dropper cap made in: USA
|
C0110 - C0117
Feb 16, 2026 - onward |
Vitamin K2 MK-4 Powder:
- Date received: Jul 7, 2025
- Made in: China (why China?)
- Purity COA (pdf)
- Purity: 100%
- 8 month follow up Purity COA (pdf)
- Purity: 99.64%
- Heavy Metals COA (pdf)
- Aluminum: < 0.5 ppm
- Arsenic: < 0.10 ppm
- Cadmium: < 0.10 ppm
- Chromium: 0.25 ppm
- Lead: < 0.10 ppm
- Mercury: < 0.05 ppm
- Nickel: < 0.10 ppm
- Microbials COA (pdf)
- Aerobic Count: 10 cfu/g
- Coliform Count: < 10 cfu/g
- E. coli Count: < 10 cfu/g
- Salmonella: negative
- Mold: < 10 cfu/g
- Yeast: < 10 cfu/g
Extra Virgin Olive Oil, Organic:
- Image (jpg)
- Brand: Kasandrinos
- Made in: Greece
- Lot #: 197 K/B
- Production: 11/2025
- Expiration: 11/2027
- Turns solid in fridge?: Yes (jpg)
Bottle, Cap & Dropper:
- Bottle material: amber glass
- Cap/bulb material: plastic, monprene TPE
- Dropper material: glass
- Bottle made in: India
- Dropper cap made in: USA
|
C0103 - C0109
Jan 3, 2026 -
Jan 16, 2026 |
Vitamin K2 MK-4 Powder:
- Date received: Jul 7, 2025
- Made in: China (why China?)
- Purity COA (pdf)
- Purity: 100%
- 8 month follow up Purity COA (pdf)
- Purity: 99.64%
- Heavy Metals COA (pdf)
- Aluminum: < 0.5 ppm
- Arsenic: < 0.10 ppm
- Cadmium: < 0.10 ppm
- Chromium: 0.25 ppm
- Lead: < 0.10 ppm
- Mercury: < 0.05 ppm
- Nickel: < 0.10 ppm
- Microbials COA (pdf)
- Aerobic Count: 10 cfu/g
- Coliform Count: < 10 cfu/g
- E. coli Count: < 10 cfu/g
- Salmonella: negative
- Mold: < 10 cfu/g
- Yeast: < 10 cfu/g
Extra Virgin Olive Oil, Organic:
- Image (jpg)
- Brand: Terra Delyssa
- Made in: Tunisia
- Lot #: L1370/51006
- Production: 04/28/2025
- Expiration: 04/27/2027
- Turns solid in fridge?: Yes (jpg)
Bottle, Cap & Dropper:
- Bottle material: amber glass
- Cap/bulb material: plastic, monprene TPE
- Dropper material: glass
- Bottle made in: India
- Dropper cap made in: USA
|
C0085 - C0102
Aug 1, 2025 -
Jan 3, 2026 |
Vitamin K2 MK-4 Powder:
- Date received: Feb 22, 2025
- Made in: China (why China?)
- Purity COA (pdf)
- Purity: 100%
- 6 month follow up Purity COA (pdf)
- Purity: 98%
- 12 month follow up Purity COA (pdf)
- Purity: 100.441%
- Heavy Metals COA (pdf)
- Aluminum: < 1.3 ppm
- Arsenic: < 0.50 ppm
- Cadmium: < 0.25 ppm
- Chromium: 6.6 ppm
- Lead: < 0.10 ppm
- Mercury: < 0.10 ppm
- Nickel: < 0.50 ppm
- Microbials COA (pdf)
- Aerobic Count: < 10 cfu/g
- Coliform Count: < 10 cfu/g
- E. coli Count: < 10 cfu/g
- Salmonella: negative
- Mold: < 10 cfu/g
- Yeast: < 10 cfu/g
Extra Virgin Olive Oil, Organic:
- Image (jpg)
- Brand: Terra Delyssa
- Made in: Tunisia
- Lot #: L1285/40795
- Production: 12/11/2024
- Expiration: 12/10/2026
- Turns solid in fridge?: Yes (jpg)
Bottle, Cap & Dropper:
- Bottle material: amber glass
- Cap/bulb material: plastic, monprene TPE
- Dropper material: glass
- Bottle made in: India
- Dropper cap made in: USA
|
C0070 - C0084
Jun 20, 2025 -
Jul 31, 2025 |
Vitamin K2 MK-4 Powder:
- Date received: Feb 22, 2025
- Made in: China (why China?)
- Purity COA (pdf)
- Purity: 100%
- 6 month follow up Purity COA (pdf)
- Purity: 98%
- 12 month follow up Purity COA (pdf)
- Purity: 100.441%
- Heavy Metals COA (pdf)
- Aluminum: < 1.3 ppm
- Arsenic: < 0.50 ppm
- Cadmium: < 0.25 ppm
- Chromium: 6.6 ppm
- Lead: < 0.10 ppm
- Mercury: < 0.10 ppm
- Nickel: < 0.50 ppm
- Microbials COA (pdf)
- Aerobic Count: < 10 cfu/g
- Coliform Count: < 10 cfu/g
- E. coli Count: < 10 cfu/g
- Salmonella: negative
- Mold: < 10 cfu/g
- Yeast: < 10 cfu/g
Extra Virgin Olive Oil, Organic:
- Image (jpg)
- Brand: Terra Delyssa
- Made in: Tunisia
- Lot #: L1285/40795
- Production: 12/11/2024
- Expiration: 12/10/2026
- Turns solid in fridge?: Yes (jpg)
Bottle, Cap & Dropper:
- Bottle material: amber glass
- Cap/bulb material: plastic and rubber
- Dropper material: glass
- Bottle and dropper cap made in: China (why China?)
|
C0001 - C0069
Apr 16, 2025 -
Jun 7, 2025 |
Vitamin K2 MK-4 Powder:
- Date received: Feb 22, 2025
- Made in: China (why China?)
- Purity COA (pdf)
- Purity: 100%
- 6 month follow up Purity COA (pdf)
- Purity: 98%
- 12 month follow up Purity COA (pdf)
- Purity: 100.441%
- Heavy Metals COA (pdf)
- Aluminum: < 1.3 ppm
- Arsenic: < 0.50 ppm
- Cadmium: < 0.25 ppm
- Chromium: 6.6 ppm
- Lead: < 0.10 ppm
- Mercury: < 0.10 ppm
- Nickel: < 0.50 ppm
- Microbials COA (pdf)
- Aerobic Count: < 10 cfu/g
- Coliform Count: < 10 cfu/g
- E. coli Count: < 10 cfu/g
- Salmonella: negative
- Mold: < 10 cfu/g
- Yeast: < 10 cfu/g
Extra Virgin Olive Oil, Organic:
- Image (jpg)
- Brand: Terra Delyssa
- Made in: Tunisia
- Lot #: L1250/42763
- Use by: 25/10/2026
- Turns solid in fridge?: Yes (jpg)
Bottle, Cap & Dropper:
- Bottle material: amber glass
- Cap/bulb material: plastic and rubber
- Dropper material: glass
- Bottle and dropper cap made in: China (why China?)
|
[go back up]
Vitamin D3 in EVOO(O) ~1,000 IU/drop, 860 drops
Serial Numbers (s/n)
& Date Range Sold |
Lab Results & Info |
D0817 - onward
soon |
Vitamin D3 Powder:
- Date received: Apr 17, 2025
- Made in: China (why China?)
- Purity COA (pdf)
- Purity: 100%
- 8 month follow up Purity COA (pdf)
- Purity: 98.341%
- Heavy Metals COA (pdf, pdf)
- Aluminum: 2.38 ppb
- Arsenic: < 0.025 ppm
- Cadmium: < 0.025 ppm
- Chromium: < 0.50 ppm
- Lead: < 0.025 ppm
- Mercury: < 0.025 ppm
- Nickel: < 0.50 ppm
- Microbials COA (pdf)
- Mold: < 10 cfu/g
- Yeast: < 10 cfu/g
- Aerobic: < 10 cfu/g
- Coliform:< 10 cfu/g
- E. coli: < 10 cfu/g
- Salmonella: negative
Extra Virgin Olive Oil, Organic:
- Image (jpg)
- Brand: Kasandrinos
- Made in: Greece
- Lot #: 219 K/B
- Production: 12/2025
- Expiration: 12/2027
- Turns solid in fridge?: Yes (jpg)
Bottle, Cap & Dropper:
- Bottle material: amber glass
- Cap/bulb material: plastic, monprene TPE
- Dropper material: glass
- Bottle made in: India
- Dropper cap made in: USA
|
D0681 - D0816
Jan 28, 2026 - onward |
Vitamin D3 Powder:
- Date received: Apr 17, 2025
- Made in: China (why China?)
- Purity COA (pdf)
- Purity: 100%
- 8 month follow up Purity COA (pdf)
- Purity: 98.341%
- Heavy Metals COA (pdf, pdf)
- Aluminum: 2.38 ppb
- Arsenic: < 0.025 ppm
- Cadmium: < 0.025 ppm
- Chromium: < 0.50 ppm
- Lead: < 0.025 ppm
- Mercury: < 0.025 ppm
- Nickel: < 0.50 ppm
- Microbials COA (pdf)
- Mold: < 10 cfu/g
- Yeast: < 10 cfu/g
- Aerobic: < 10 cfu/g
- Coliform:< 10 cfu/g
- E. coli: < 10 cfu/g
- Salmonella: negative
Extra Virgin Olive Oil, Organic:
- Image (jpg)
- Brand: Kasandrinos
- Made in: Greece
- Lot #: 197 K/B
- Production: 11/2025
- Expiration: 11/2027
- Turns solid in fridge?: Yes (jpg)
Bottle, Cap & Dropper:
- Bottle material: amber glass
- Cap/bulb material: plastic, monprene TPE
- Dropper material: glass
- Bottle made in: India
- Dropper cap made in: USA
|
D0635 - D0680
Jan 16, 2026 -
Jan 28, 2026
|
Vitamin D3 Powder:
- Date received: Apr 17, 2025
- Made in: China (why China?)
- Purity COA (pdf)
- Purity: 100%
- 8 month follow up Purity COA (pdf)
- Purity: 98.341%
- Heavy Metals COA (pdf, pdf)
- Aluminum: 2.38 ppb
- Arsenic: < 0.025 ppm
- Cadmium: < 0.025 ppm
- Chromium: < 0.50 ppm
- Lead: < 0.025 ppm
- Mercury: < 0.025 ppm
- Nickel: < 0.50 ppm
- Microbials COA (pdf)
- Mold: < 10 cfu/g
- Yeast: < 10 cfu/g
- Aerobic: < 10 cfu/g
- Coliform:< 10 cfu/g
- E. coli: < 10 cfu/g
- Salmonella: negative
Extra Virgin Olive Oil, Organic:
- Image (jpg)
- Brand: Terra Delyssa
- Made in: Tunisia
- Lot #: L1370/51006
- Production: 04/28/2025
- Expiration: 04/27/2027
- Turns solid in fridge?: Yes (jpg)
Bottle, Cap & Dropper:
- Bottle material: amber glass
- Cap/bulb material: plastic, monprene TPE
- Dropper material: glass
- Bottle made in: India
- Dropper cap made in: USA
|
D0591 - D0634
Jan 1, 2026 -
Jan 16, 2026 |
Vitamin D3 Powder:
- Date received: Jan 02, 2025
- Made in: China (why China?)
- Purity COA (pdf)
- Purity: 99%
- Cert. Std. QC Purity: 100%
- 6 month follow up Purity COA (pdf)
- Purity: 100%
- 12 month follow up Purity COA (pdf)
- Purity: 99.899%
- We ran out of this batch of D3, so we won't be able to do anymore follow up testing :(
- Heavy Metals COA (pdf)
- Aluminum: < 0.5 ppm
- Arsenic: < 0.50 ppm
- Cadmium: < 0.25 ppm
- Chromium: < 0.50 ppm
- Lead: < 0.50 ppm
- Mercury: < 0.10 ppm
- Nickel: < 0.50 ppm
- Microbials COA (pdf)
- Mold: < 10 cfu/g
- Yeast: < 10 cfu/g
- Aerobic: < 10 cfu/g
- Coliform:< 10 cfu/g
- E. coli: < 10 cfu/g
- Salmonella: negative
Extra Virgin Olive Oil, Organic:
- Image (jpg)
- Brand: Terra Delyssa
- Made in: Tunisia
- Lot #: L1370/51006
- Production: 04/28/2025
- Expiration: 04/27/2027
- Turns solid in fridge?: Yes (jpg)
Bottle, Cap & Dropper:
- Bottle material: amber glass
- Cap/bulb material: plastic, monprene TPE
- Dropper material: glass
- Bottle made in: India
- Dropper cap made in: USA
|
D0507 - D0590
Nov 29, 2025 -
Jan 1, 2026 |
Vitamin D3 Powder:
- Date received: Jan 02, 2025
- Made in: China (why China?)
- Purity COA (pdf)
- Purity: 99%
- Cert. Std. QC Purity: 100%
- 6 month follow up Purity COA (pdf)
- Purity: 100%
- 12 month follow up Purity COA (pdf)
- Purity: 99.899%
- We ran out of this batch of D3, so we won't be able to do anymore follow up testing :(
- Heavy Metals COA (pdf)
- Aluminum: < 0.5 ppm
- Arsenic: < 0.50 ppm
- Cadmium: < 0.25 ppm
- Chromium: < 0.50 ppm
- Lead: < 0.50 ppm
- Mercury: < 0.10 ppm
- Nickel: < 0.50 ppm
- Microbials COA (pdf)
- Mold: < 10 cfu/g
- Yeast: < 10 cfu/g
- Aerobic: < 10 cfu/g
- Coliform:< 10 cfu/g
- E. coli: < 10 cfu/g
- Salmonella: negative
Extra Virgin Olive Oil, Organic:
- Image (jpg)
- Brand: Terra Delyssa
- Made in: Tunisia
- Lot #: L1384/51024
- Production: 05/21/2025
- Expiration: 05/20/2027
- Turns solid in fridge?: Yes (jpg)
Bottle, Cap & Dropper:
- Bottle material: amber glass
- Cap/bulb material: plastic, monprene TPE
- Dropper material: glass
- Bottle made in: India
- Dropper cap made in: USA
|
D0427 - D0506
Oct 11, 2025 -
Nov 28, 2025
|
Vitamin D3 Powder:
- Date received: Jan 02, 2025
- Made in: China (why China?)
- Purity COA (pdf)
- Purity: 99%
- Cert. Std. QC Purity: 100%
- 6 month follow up Purity COA (pdf)
- Purity: 100%
- 12 month follow up Purity COA (pdf)
- Purity: 99.899%
- We ran out of this batch of D3, so we won't be able to do anymore follow up testing :(
- Heavy Metals COA (pdf)
- Aluminum: < 0.5 ppm
- Arsenic: < 0.50 ppm
- Cadmium: < 0.25 ppm
- Chromium: < 0.50 ppm
- Lead: < 0.50 ppm
- Mercury: < 0.10 ppm
- Nickel: < 0.50 ppm
- Microbials COA (pdf)
- Mold: < 10 cfu/g
- Yeast: < 10 cfu/g
- Aerobic: < 10 cfu/g
- Coliform:< 10 cfu/g
- E. coli: < 10 cfu/g
- Salmonella: negative
Extra Virgin Olive Oil, Organic:
- Image (jpg)
- Brand: Terra Delyssa
- Made in: Tunisia
- Lot #: L1303/52874
- Production: 01/18/2025
- Expiration: 01/17/2027
- Turns solid in fridge?: Yes (jpg)
Bottle, Cap & Dropper:
- Bottle material: amber glass
- Cap/bulb material: plastic, monprene TPE
- Dropper material: glass
- Bottle made in: India
- Dropper cap made in: USA
|
D0317 - D0426
Aug 1, 2025 -
Oct 10, 2025 |
Vitamin D3 Powder:
- Date received: Jan 02, 2025
- Made in: China (why China?)
- Purity COA (pdf)
- Purity: 99%
- Cert. Std. QC Purity: 100%
- 6 month follow up Purity COA (pdf)
- Purity: 100%
- 12 month follow up Purity COA (pdf)
- Purity: 99.899%
- We ran out of this batch of D3, so we won't be able to do anymore follow up testing :(
- Heavy Metals COA (pdf)
- Aluminum: < 0.5 ppm
- Arsenic: < 0.50 ppm
- Cadmium: < 0.25 ppm
- Chromium: < 0.50 ppm
- Lead: < 0.50 ppm
- Mercury: < 0.10 ppm
- Nickel: < 0.50 ppm
- Microbials COA (pdf)
- Mold: < 10 cfu/g
- Yeast: < 10 cfu/g
- Aerobic: < 10 cfu/g
- Coliform:< 10 cfu/g
- E. coli: < 10 cfu/g
- Salmonella: negative
Extra Virgin Olive Oil, Organic:
- Image (jpg)
- Brand: Terra Delyssa
- Made in: Tunisia
- Lot #: L1285/40795
- Production: 12/11/2024
- Expiration: 12/10/2026
- Turns solid in fridge?: Yes (jpg)
Bottle, Cap & Dropper:
- Bottle material: amber glass
- Cap/bulb material: plastic, monprene TPE
- Dropper material: glass
- Bottle made in: India
- Dropper cap made in: USA
|
D0267 - D0316
Jun 21, 2025 -
Jul 30, 2025 |
Vitamin D3 Powder:
- Date received: Jan 02, 2025
- Made in: China (why China?)
- Purity COA (pdf)
- Purity: 99%
- Cert. Std. QC Purity: 100%
- 6 month follow up Purity COA (pdf)
- Purity: 100%
- 12 month follow up Purity COA (pdf)
- Purity: 99.899%
- We ran out of this batch of D3, so we won't be able to do anymore follow up testing :(
- Heavy Metals COA (pdf)
- Aluminum: < 0.5 ppm
- Arsenic: < 0.50 ppm
- Cadmium: < 0.25 ppm
- Chromium: < 0.50 ppm
- Lead: < 0.50 ppm
- Mercury: < 0.10 ppm
- Nickel: < 0.50 ppm
- Microbials COA (pdf)
- Mold: < 10 cfu/g
- Yeast: < 10 cfu/g
- Aerobic: < 10 cfu/g
- Coliform:< 10 cfu/g
- E. coli: < 10 cfu/g
- Salmonella: negative
Extra Virgin Olive Oil, Organic:
- Image (jpg)
- Brand: Terra Delyssa
- Made in: Tunisia
- Lot #: L1285/40795
- Production: 12/11/2024
- Expiration: 12/10/2026
- Turns solid in fridge?: Yes (jpg)
Bottle, Cap & Dropper:
- Bottle material: amber glass
- Cap/bulb material: plastic and rubber
- Dropper material: glass
- Bottle and dropper cap made in: China (why China?)
|
D0177 - D0266
May 1, 2025 -
Jun 20, 2025 |
Vitamin D3 Powder:
- Date received: Jan 02, 2025
- Made in: China (why China?)
- Purity COA (pdf)
- Purity: 99%
- Cert. Std. QC Purity: 100%
- 6 month follow up Purity COA (pdf)
- Purity: 100%
- 12 month follow up Purity COA (pdf)
- Purity: 99.899%
- We ran out of this batch of D3, so we won't be able to do anymore follow up testing :(
- Heavy Metals COA (pdf)
- Aluminum: < 0.5 ppm
- Arsenic: < 0.50 ppm
- Cadmium: < 0.25 ppm
- Chromium: < 0.50 ppm
- Lead: < 0.50 ppm
- Mercury: < 0.10 ppm
- Nickel: < 0.50 ppm
- Microbials COA (pdf)
- Mold: < 10 cfu/g
- Yeast: < 10 cfu/g
- Aerobic: < 10 cfu/g
- Coliform:< 10 cfu/g
- E. coli: < 10 cfu/g
- Salmonella: negative
Extra Virgin Olive Oil, Organic:
- Image (jpg)
- Brand: Terra Delyssa
- Made in: Tunisia
- Lot #: L1282/42802
- Production: 12/09/2024
- Expiration: 12/08/2026
- Turns solid in fridge?: Yes (jpg)
Bottle, Cap & Dropper:
- Bottle material: amber glass
- Cap/bulb material: plastic and rubber
- Dropper material: glass
- Bottle and dropper cap made in: China (why China?)
|
D0140 - D0176
Apr 11, 2025 -
May 1, 2025 |
Vitamin D3 Powder:
- Date received: Jan 02, 2025
- Made in: China (why China?)
- Purity COA (pdf)
- Purity: 99%
- Cert. Std. QC Purity: 100%
- 6 month follow up Purity COA (pdf)
- Purity: 100%
- 12 month follow up Purity COA (pdf)
- Purity: 99.899%
- We ran out of this batch of D3, so we won't be able to do anymore follow up testing :(
- Heavy Metals COA (pdf)
- Aluminum: < 0.5 ppm
- Arsenic: < 0.50 ppm
- Cadmium: < 0.25 ppm
- Chromium: < 0.50 ppm
- Lead: < 0.50 ppm
- Mercury: < 0.10 ppm
- Nickel: < 0.50 ppm
- Microbials COA (pdf)
- Mold: < 10 cfu/g
- Yeast: < 10 cfu/g
- Aerobic: < 10 cfu/g
- Coliform:< 10 cfu/g
- E. coli: < 10 cfu/g
- Salmonella: negative
Extra Virgin Olive Oil, Organic:
- Image (jpg)
- Brand: Terra Delyssa
- Made in: Tunisia
- Lot #: L1250/42763
- Use by: 25/10/2026
- Turns solid in fridge?: Yes (jpg)
Bottle, Cap & Dropper:
- Bottle material: amber glass
- Cap/bulb material: plastic and rubber
- Dropper material: glass
- Bottle and dropper cap made in: China (why China?)
|
D0001 - D0139
Jan 30, 2025 -
Apr 10, 2025 |
Vitamin D3 Powder:
- Date received: Jan 02, 2025
- Made in: China (why China?)
- Purity COA (pdf)
- Purity: 99%
- Cert. Std. QC Purity: 100%
- 6 month follow up Purity COA (pdf)
- Purity: 100%
- 12 month follow up Purity COA (pdf)
- Purity: 99.899%
- We ran out of this batch of D3, so we won't be able to do anymore follow up testing :(
- Heavy Metals COA (pdf)
- Aluminum: < 0.5 ppm
- Arsenic: < 0.50 ppm
- Cadmium: < 0.25 ppm
- Chromium: < 0.50 ppm
- Lead: < 0.50 ppm
- Mercury: < 0.10 ppm
- Nickel: < 0.50 ppm
- Microbials COA (pdf)
- Mold: < 10 cfu/g
- Yeast: < 10 cfu/g
- Aerobic: < 10 cfu/g
- Coliform:< 10 cfu/g
- E. coli: < 10 cfu/g
- Salmonella: negative
Extra Virgin Olive Oil, Organic:
- Image (jpg)
- Brand: Terra Delyssa
- Made in: Tunisia
- Lot #: L1250/42763
- Use by: 25/10/2026
- Turns solid in fridge?: Yes (jpg)
Bottle, Cap & Dropper:
- Bottle material: amber glass
- Cap/bulb material: plastic, monprene TPE
- Dropper material: glass
- Bottle made in: India
- Dropper cap made in: USA
|
[go back up]
Vitamin D3 in EVOO(O) ~5,000 IU/drop, 860 drops
Serial Numbers (s/n)
& Date Range Sold |
Lab Results & Info |
|
K0025 - onward
soon
|
Vitamin D3 Powder:
- Date received: Apr 17, 2025
- Made in: China (why China?)
- Purity COA (pdf)
- Purity: 100%
- 8 month follow up Purity COA (pdf)
- Purity: 98.341%
- Heavy Metals COA (pdf, pdf)
- Aluminum: 2.38 ppb
- Arsenic: < 0.025 ppm
- Cadmium: < 0.025 ppm
- Chromium: < 0.50 ppm
- Lead: < 0.025 ppm
- Mercury: < 0.025 ppm
- Nickel: < 0.50 ppm
- Microbials COA (pdf)
- Mold: < 10 cfu/g
- Yeast: < 10 cfu/g
- Aerobic: < 10 cfu/g
- Coliform:< 10 cfu/g
- E. coli: < 10 cfu/g
- Salmonella: negative
Extra Virgin Olive Oil, Organic:
- Image (jpg)
- Brand: Kasandrinos
- Made in: Greece
- Lot #: 219 K/B
- Production: 12/2025
- Expiration: 12/2027
- Turns solid in fridge?: Yes (jpg)
Bottle, Cap & Dropper:
- Bottle material: amber glass
- Cap/bulb material: plastic, monprene TPE
- Dropper material: glass
- Bottle made in: India
- Dropper cap made in: USA
|
|
K0001 - K0024
Feb 24, 2026 - onward
|
Vitamin D3 Powder:
- Date received: Apr 17, 2025
- Made in: China (why China?)
- Purity COA (pdf)
- Purity: 100%
- 8 month follow up Purity COA (pdf)
- Purity: 98.341%
- Heavy Metals COA (pdf, pdf)
- Aluminum: 2.38 ppb
- Arsenic: < 0.025 ppm
- Cadmium: < 0.025 ppm
- Chromium: < 0.50 ppm
- Lead: < 0.025 ppm
- Mercury: < 0.025 ppm
- Nickel: < 0.50 ppm
- Microbials COA (pdf)
- Mold: < 10 cfu/g
- Yeast: < 10 cfu/g
- Aerobic: < 10 cfu/g
- Coliform:< 10 cfu/g
- E. coli: < 10 cfu/g
- Salmonella: negative
Extra Virgin Olive Oil, Organic:
- Image (jpg)
- Brand: Kasandrinos
- Made in: Greece
- Lot #: 197 K/B
- Production: 11/2025
- Expiration: 11/2027
- Turns solid in fridge?: Yes (jpg)
Bottle, Cap & Dropper:
- Bottle material: amber glass
- Cap/bulb material: plastic, monprene TPE
- Dropper material: glass
- Bottle made in: India
- Dropper cap made in: USA
|
[go back up]
Vitamin D3 in EVOO(O) ~10,000 IU/drop, 860 drops
Serial Numbers (s/n)
& Date Range Sold |
Lab Results & Info |
|
E0060 - E0069
Feb 4, 2026 - onward
|
Vitamin D3 Powder:
- Date received: Apr 17, 2025
- Made in: China (why China?)
- Purity COA (pdf)
- Purity: 100%
- 8 month follow up Purity COA (pdf)
- Purity: 98.341%
- Heavy Metals COA (pdf, pdf)
- Aluminum: 2.38 ppb
- Arsenic: < 0.025 ppm
- Cadmium: < 0.025 ppm
- Chromium: < 0.50 ppm
- Lead: < 0.025 ppm
- Mercury: < 0.025 ppm
- Nickel: < 0.50 ppm
- Microbials COA (pdf)
- Mold: < 10 cfu/g
- Yeast: < 10 cfu/g
- Aerobic: < 10 cfu/g
- Coliform:< 10 cfu/g
- E. coli: < 10 cfu/g
- Salmonella: negative
Extra Virgin Olive Oil, Organic:
- Image (jpg)
- Brand: Kasandrinos
- Made in: Greece
- Lot #: 197 K/B
- Production: 11/2025
- Expiration: 11/2027
- Turns solid in fridge?: Yes (jpg)
Bottle, Cap & Dropper:
- Bottle material: amber glass
- Cap/bulb material: plastic, monprene TPE
- Dropper material: glass
- Bottle made in: India
- Dropper cap made in: USA
|
|
E0052 - E0059
Jan 15, 2026 -
Feb 18, 2026
(included in this batch are 2 bottles with mistaken serials of D0057 and D0058)
|
Vitamin D3 Powder:
- Date received: Apr 17, 2025
- Made in: China (why China?)
- Purity COA (pdf)
- Purity: 100%
- 8 month follow up Purity COA (pdf)
- Purity: 98.341%
- Heavy Metals COA (pdf, pdf)
- Aluminum: 2.38 ppb
- Arsenic: < 0.025 ppm
- Cadmium: < 0.025 ppm
- Chromium: < 0.50 ppm
- Lead: < 0.025 ppm
- Mercury: < 0.025 ppm
- Nickel: < 0.50 ppm
- Microbials COA (pdf)
- Mold: < 10 cfu/g
- Yeast: < 10 cfu/g
- Aerobic: < 10 cfu/g
- Coliform:< 10 cfu/g
- E. coli: < 10 cfu/g
- Salmonella: negative
Extra Virgin Olive Oil, Organic:
- Image (jpg)
- Brand: Terra Delyssa
- Made in: Tunisia
- Lot #: L1370/51006
- Production: 04/28/2025
- Expiration: 04/27/2027
- Turns solid in fridge?: Yes (jpg)
Bottle, Cap & Dropper:
- Bottle material: amber glass
- Cap/bulb material: plastic, monprene TPE
- Dropper material: glass
- Bottle made in: India
- Dropper cap made in: USA
|
|
E0046 - E0051
Jan 5, 2026 -
Jan 14, 2026
|
Vitamin D3 Powder:
- Date received: Jan 02, 2025
- Made in: China (why China?)
- Purity COA (pdf)
- Purity: 99%
- Cert. Std. QC Purity: 100%
- 6 month follow up Purity COA (pdf)
- Purity: 100%
- 12 month follow up Purity COA (pdf)
- Purity: 99.899%
- We ran out of this batch of D3, so we won't be able to do anymore follow up testing :(
- Heavy Metals COA (pdf)
- Aluminum: < 0.5 ppm
- Arsenic: < 0.50 ppm
- Cadmium: < 0.25 ppm
- Chromium: < 0.50 ppm
- Lead: < 0.50 ppm
- Mercury: < 0.10 ppm
- Nickel: < 0.50 ppm
- Microbials COA (pdf)
- Mold: < 10 cfu/g
- Yeast: < 10 cfu/g
- Aerobic: < 10 cfu/g
- Coliform:< 10 cfu/g
- E. coli: < 10 cfu/g
- Salmonella: negative
Extra Virgin Olive Oil, Organic:
- Image (jpg)
- Brand: Terra Delyssa
- Made in: Tunisia
- Lot #: L1370/51006
- Production: 04/28/2025
- Expiration: 04/27/2027
- Turns solid in fridge?: Yes (jpg)
Bottle, Cap & Dropper:
- Bottle material: amber glass
- Cap/bulb material: plastic, monprene TPE
- Dropper material: glass
- Bottle made in: India
- Dropper cap made in: USA
|
E0038 - E0045
Dec 19, 2025 -
Jan 4, 2026 |
Vitamin D3 Powder:
- Date received: Jan 02, 2025
- Made in: China (why China?)
- Purity COA (pdf)
- Purity: 99%
- Cert. Std. QC Purity: 100%
- 6 month follow up Purity COA (pdf)
- Purity: 100%
- 12 month follow up Purity COA (pdf)
- Purity: 99.899%
- We ran out of this batch of D3, so we won't be able to do anymore follow up testing :(
- Heavy Metals COA (pdf)
- Aluminum: < 0.5 ppm
- Arsenic: < 0.50 ppm
- Cadmium: < 0.25 ppm
- Chromium: < 0.50 ppm
- Lead: < 0.50 ppm
- Mercury: < 0.10 ppm
- Nickel: < 0.50 ppm
- Microbials COA (pdf)
- Mold: < 10 cfu/g
- Yeast: < 10 cfu/g
- Aerobic: < 10 cfu/g
- Coliform:< 10 cfu/g
- E. coli: < 10 cfu/g
- Salmonella: negative
Extra Virgin Olive Oil, Organic:
- Image (jpg)
- Brand: Terra Delyssa
- Made in: Tunisia
- Lot #: L1384/51024
- Production: 05/21/2025
- Expiration: 05/20/2027
- Turns solid in fridge?: Yes (jpg)
Bottle, Cap & Dropper:
- Bottle material: amber glass
- Cap/bulb material: plastic, monprene TPE
- Dropper material: glass
- Bottle made in: India
- Dropper cap made in: USA
|
E0013 - E0037
Jun 20, 2025 -
Dec 19, 2025 |
Vitamin D3 Powder:
- Date received: Jan 02, 2025
- Made in: China (why China?)
- Purity COA (pdf)
- Purity: 99%
- Cert. Std. QC Purity: 100%
- 6 month follow up Purity COA (pdf)
- Purity: 100%
- 12 month follow up Purity COA (pdf)
- Purity: 99.899%
- We ran out of this batch of D3, so we won't be able to do anymore follow up testing :(
- Heavy Metals COA (pdf)
- Aluminum: < 0.5 ppm
- Arsenic: < 0.50 ppm
- Cadmium: < 0.25 ppm
- Chromium: < 0.50 ppm
- Lead: < 0.50 ppm
- Mercury: < 0.10 ppm
- Nickel: < 0.50 ppm
- Microbials COA (pdf)
- Mold: < 10 cfu/g
- Yeast: < 10 cfu/g
- Aerobic: < 10 cfu/g
- Coliform:< 10 cfu/g
- E. coli: < 10 cfu/g
- Salmonella: negative
Extra Virgin Olive Oil, Organic:
- Image (jpg)
- Brand: Terra Delyssa
- Made in: Tunisia
- Lot #: L1285/40795
- Production: 12/11/2024
- Expiration: 12/10/2026
- Turns solid in fridge?: Yes (jpg)
Bottle, Cap & Dropper:
- Bottle material: amber glass
- Cap/bulb material: plastic, monprene TPE
- Dropper material: glass
- Bottle made in: India
- Dropper cap made in: USA
|
E0001 - E0012
Jan 30, 2025 -
Jun 20, 2025 |
Vitamin D3 Powder:
- Date received: Jan 02, 2025
- Made in: China (why China?)
- Purity COA (pdf)
- Purity: 99%
- Cert. Std. QC Purity: 100%
- 6 month follow up Purity COA (pdf)
- Purity: 100%
- 12 month follow up Purity COA (pdf)
- Purity: 99.899%
- We ran out of this batch of D3, so we won't be able to do anymore follow up testing :(
- Heavy Metals COA (pdf)
- Aluminum: < 0.5 ppm
- Arsenic: < 0.50 ppm
- Cadmium: < 0.25 ppm
- Chromium: < 0.50 ppm
- Lead: < 0.50 ppm
- Mercury: < 0.10 ppm
- Nickel: < 0.50 ppm
- Microbials COA (pdf)
- Mold: < 10 cfu/g
- Yeast: < 10 cfu/g
- Aerobic: < 10 cfu/g
- Coliform:< 10 cfu/g
- E. coli: < 10 cfu/g
- Salmonella: negative
Extra Virgin Olive Oil, Organic:
- Image (jpg)
- Brand: Terra Delyssa
- Made in: Tunisia
- Lot #: L1250/42763
- Use by: 25/10/2026
- Turns solid in fridge?: Yes (jpg)
Bottle, Cap & Dropper:
- Bottle material: amber glass
- Cap/bulb material: plastic, monprene TPE
- Dropper material: glass
- Bottle made in: India
- Dropper cap made in: USA
|
[go back up]
Magnesium Glycinate Powder (100 g)
Serial Numbers (s/n)
& Date Range Sold |
Lab Results & Info |
M0100 - onward
Oct 2, 2025 - onward |
Magnesium Glycinate Powder
- Date received batch: Sep 17, 2025
- Made in: China (why China?)
- Purity COA (pdf)
- Magnesium: 11%
- Glycine: 71.93%
- Heavy Metals COA (pdf)
- Aluminum: 0.67 ppm
- Arsenic: < 0.10 ppm
- Cadmium: < 0.10 ppm
- Chromium: 0.13 ppm
- Lead: < 0.10 ppm
- Mercury: < 0.10 ppm
- Nickel: < 0.10 ppm
- Microbials COA (pdf)
- Aerobic: < 10 cfu/g
- Coliform:< 10 cfu/g
- E. coli: < 10 cfu/g
- Salmonella: negative
- Mold: < 10 cfu/g
- Yeast: < 10 cfu/g
Bottle & Cap:
- Bottle material: amber glass
- Cap/seal: phenolic plastic cap and LDPE cone liner
- Bottle made in: India
- Cap made in: USA
|
M0001 - M0099
Apr 21, 2025 -
Sep 27, 2025 |
Magnesium Glycinate Powder:
- Date received batch: Mar 11, 2025
- Made in: China (why China?)
- Purity COA (pdf, pdf)
- Magnesium: 11%
- Glycine: 71.23%
- Heavy Metals COA (pdf, pdf)
- Aluminum: 7.4 ppm
- Arsenic: < 0.50 ppm
- Cadmium: < 0.25 ppm
- Chromium: < 0.50 ppm
- Lead: < 0.50 ppm
- Mercury: < 0.10 ppm
- Nickel: < 0.50 ppm
- Microbials COA (pdf)
- Aerobic: < 10 cfu/g
- Coliform:< 10 cfu/g
- E. coli: < 10 cfu/g
- Salmonella: negative
- Mold: < 10 cfu/g
- Yeast: < 10 cfu/g
Bottle & Cap:
- Bottle material: amber glass
- Cap/seal: phenolic plastic cap and LDPE cone liner
- Bottle made in: India
- Cap made in: USA
|
[go back up]
Magnesium Glycinate Powder (300 g)
Serial Numbers (s/n)
& Date Range Sold |
Lab Results & Info |
N0001 - onward
Dec 2, 2025 - onward |
Magnesium Glycinate Powder
- Date received batch: Sep 17, 2025
- Made in: China (why China?)
- Purity COA (pdf)
- Magnesium: 11%
- Glycine: 71.93%
- Heavy Metals COA (pdf)
- Aluminum: 0.67 ppm
- Arsenic: < 0.10 ppm
- Cadmium: < 0.10 ppm
- Chromium: 0.13 ppm
- Lead: < 0.10 ppm
- Mercury: < 0.10 ppm
- Nickel: < 0.10 ppm
- Microbials COA (pdf)
- Aerobic: < 10 cfu/g
- Coliform:< 10 cfu/g
- E. coli: < 10 cfu/g
- Salmonella: negative
- Mold: < 10 cfu/g
- Yeast: < 10 cfu/g
Bottle & Cap:
- Bottle material: amber glass
- Cap/seal: polypropylene cap and F217 foam liner
- Bottle & cap made in: USA
|
[go back up]
Eggshell Calcium Powder (125 g)
Serial Numbers (s/n)
& Date Range Sold |
Lab Results & Info |
|
H0042 - onward
Mar 3, 2026 - onward
|
Eggshell Powder:
- Date received: Jan 12, 2026
- Made in: China (why China?)
- Purity COA (pdf*)
- Calcium: 40%
- Metals/Non-Metals COA (pdf, pdf)
- Aluminum: 0.26 ppm
- Arsenic: < 0.10 ppm
- Cadmium: < 0.10 ppm
- Chromium: 0.11 ppm
- Fluoride: < 5 ppm
- Lead: < 0.10 ppm
- Mercury: < 0.05 ppm
- Nickel: < 0.10 ppm
- Microbials COA* (pdf)
- *our initial COA had some microbial levels that were out of range. we heat sterilized the eggshell calcium and re-tested. see the initial COA (pdf).
- *this is the re-tested part 2 of 2.
- Aerobic: 600 cfu/g
- Coliform:< 10 cfu/g
- E. coli: < 10 cfu/g
- Salmonella: negative
- Mold: < 10 cfu/g
- Yeast: < 10 cfu/g
- Particle Size (pdf)
- Average: 17.50 µm
Bottle & Cap:
- Bottle material: amber glass
- Cap/seal: polypropylene cap and F217 foam liner
- Bottle made in: India
- Cap made in: USA
|
H0027 - H0041
Feb 6, 2026 -
Mar 3, 2026
|
Eggshell Powder:
- Date received: Jan 12, 2026
- Made in: China (why China?)
- Purity COA (pdf*)
- Calcium: 40%
- Metals/Non-Metals COA (pdf, pdf)
- Aluminum: 0.26 ppm
- Arsenic: < 0.10 ppm
- Cadmium: < 0.10 ppm
- Chromium: 0.11 ppm
- Fluoride: < 5 ppm
- Lead: < 0.10 ppm
- Mercury: < 0.05 ppm
- Nickel: < 0.10 ppm
- Microbials COA* (pdf)
- *our initial COA had some microbial levels that were out of range. we heat sterilized the eggshell calcium and re-tested. see the initial COA (pdf).
- Aerobic: 1,800 cfu/g
- Coliform:< 10 cfu/g
- E. coli: < 10 cfu/g
- Salmonella: negative
- Mold: < 10 cfu/g
- Yeast: < 10 cfu/g
- Particle Size (pdf)
- Average: 17.50 µm
Bottle & Cap:
- Bottle material: amber glass
- Cap/seal: phenolic plastic cap and LDPE cone liner
- Bottle made in: India
- Cap made in: USA
|
H0001 - H0026
Dec 8, 2025 -
Jan 31, 2026 |
Eggshell Powder:
- Date received: Sep 08, 2025
- Made in: China (why China?)
- Purity COA (pdf)
- Calcium: 37%
- Metals/Non-Metals COA (pdf, pdf)
- Aluminum: 0.86 ppm
- Arsenic: < 0.08 ppm
- Cadmium: < 0.08 ppm
- Chromium: 0.18 ppm
- Fluoride: < 10 ppm
- Lead: < 0.06 ppm
- Mercury: < 0.05 ppm
- Nickel: 2.8 ppm
- Microbials COA (pdf)
- Aerobic: 4,900 cfu/g
- Coliform:< 10 cfu/g
- E. coli: < 10 cfu/g
- Salmonella: negative
- Mold: < 10 cfu/g
- Yeast: < 10 cfu/g
- Particle Size (pdf)
- Average: 20.14 µm
Bottle & Cap:
- Bottle material: amber glass
- Cap/seal: phenolic plastic cap and LDPE cone liner
- Bottle made in: India
- Cap made in: USA
|
[go back up]
Eggshell Calcium Powder (400 g)
Serial Numbers (s/n)
& Date Range Sold |
Lab Results & Info |
|
G0098 - onward
soon
|
Eggshell Powder:
- Date received: Jan 12, 2026
- Made in: China (why China?)
- Purity COA (pdf*)
- Calcium: 40%
- Metals/Non-Metals COA (pdf, pdf)
- Aluminum: 0.26 ppm
- Arsenic: < 0.10 ppm
- Cadmium: < 0.10 ppm
- Chromium: 0.11 ppm
- Fluoride: < 5 ppm
- Lead: < 0.10 ppm
- Mercury: < 0.05 ppm
- Nickel: < 0.10 ppm
- Microbials COA* (pdf)
- *our initial COA had some microbial levels that were out of range. we heat sterilized the eggshell calcium and re-tested. see the initial COA (pdf).
- *this is the re-tested part 2 of 2.
- Aerobic: 600 cfu/g
- Coliform:< 10 cfu/g
- E. coli: < 10 cfu/g
- Salmonella: negative
- Mold: < 10 cfu/g
- Yeast: < 10 cfu/g
- Particle Size (pdf)
- Average: 17.50 µm
Bottle & Cap:
- Bottle material: amber glass
- Cap/seal: polypropylene cap and F217 foam liner
- Bottle & cap made in: USA
|
G0076 - G0097
Feb 6, 2026 - onward |
Eggshell Powder:
- Date received: Jan 12, 2026
- Made in: China (why China?)
- Purity COA (pdf*)
- Calcium: 40%
- Metals/Non-Metals COA (pdf, pdf)
- Aluminum: 0.26 ppm
- Arsenic: < 0.10 ppm
- Cadmium: < 0.10 ppm
- Chromium: 0.11 ppm
- Fluoride: < 5 ppm
- Lead: < 0.10 ppm
- Mercury: < 0.05 ppm
- Nickel: < 0.10 ppm
- Microbials COA* (pdf)
- *our initial COA had some microbial levels that were out of range. we heat sterilized the eggshell calcium and re-tested. see the initial COA (pdf).
- *this is the re-tested part 1 of 2.
- Aerobic: 1,800 cfu/g
- Coliform:< 10 cfu/g
- E. coli: < 10 cfu/g
- Salmonella: negative
- Mold: < 10 cfu/g
- Yeast: < 10 cfu/g
- Particle Size (pdf)
- Average: 17.50 µm
Bottle & Cap:
- Bottle material: amber glass
- Cap/seal: polypropylene cap and F217 foam liner
- Bottle & cap made in: USA
|
G0023 - G0075
Oct 21, 2025 -
Jan 29, 2026 |
Eggshell Powder:
- Date received: Sep 08, 2025
- Made in: China (why China?)
- Purity COA (pdf)
- Calcium: 37%
- Metals/Non-Metals COA (pdf, pdf)
- Aluminum: 0.86 ppm
- Arsenic: < 0.08 ppm
- Cadmium: < 0.08 ppm
- Chromium: 0.18 ppm
- Fluoride: < 10 ppm
- Lead: < 0.06 ppm
- Mercury: < 0.05 ppm
- Nickel: 2.8 ppm
- Microbials COA (pdf)
- Aerobic: 4,900 cfu/g
- Coliform:< 10 cfu/g
- E. coli: < 10 cfu/g
- Salmonella: negative
- Mold: < 10 cfu/g
- Yeast: < 10 cfu/g
- Particle Size (pdf)
- Average: 20.14 µm
Bottle & Cap:
- Bottle material: amber glass
- Cap/seal: polypropylene cap and F217 foam liner
- Bottle & cap made in: USA
|
G0001 - G0022
Sep 18, 2025 -
Oct 20, 2025 |
Eggshell Powder:
- Date received: Jul 16, 2025
- Made in: China (why China?)
- Purity COA (pdf)
- Calcium: 43%
- Metals/Non-Metals COA (pdf, pdf)
- Aluminum: < 1.0 ppm
- Arsenic: < 0.10 ppm
- Cadmium: < 0.10 ppm
- Chromium: 0.18 ppm
- Fluoride: < 10 ppm
- Lead: < 0.10 ppm
- Mercury: < 0.05 ppm
- Nickel: 0.10 ppm
- Microbials COA (pdf)
- Aerobic: 12,000 cfu/g
- Coliform:< 10 cfu/g
- E. coli: < 10 cfu/g
- Salmonella: negative
- Mold: < 10 cfu/g
- Yeast: < 10 cfu/g
- Particle Size (pdf)
- Average: 20.26 µm
Bottle & Cap:
- Bottle material: amber glass
- Cap/seal: polypropylene cap and F217 foam liner
- Bottle & cap made in: USA
|
[go back up]
*1 How did the COA result come back at 110%? Is this a joke?
We had the same question when we saw the COA. Looking at the comments section of the COA above the "SGS Sample ID" we have a blurb from the lab:
A simplified layman's translation of the comment and COA: When the lab we hired ran a sample of our vitamin k2 mk-4 and a certified reference sample of the same vitamin through the same instrument on the same day using the same technique and person, both samples produced a final result of 110%. This indicates that both samples have a high degree of similarity.
If you want to geek out with us on the nitty gritty details, we appreciate your diligence. Please keep reading!
Understanding how any result above 100% is possible, we also need to understand how the lab analyzes the purity of a given sample.
Lab instruments only produce reportable results when the results fall within the instrument's calibration curve. The calibration curve is a range of sample concentrations where the instrument has been determined to produce acceptable results (more on calibration curves, pdf).
For example, if the range of the instrument's calibration curve is from 0.1 to 20 ug/mL (micrograms per milliliter), then we would have to dilute our, potentially close to 100%, sample down into that range (preferably near the middle of the range).
If we wanted to dilute our sample down to 5 ug/mL, then we could take 0.05 g of our sample and mix it with 10,000 mL of solution. This creates a 5 ug/mL dilution:
0.05 g ÷ 10,000 mL = 50,000 ug ÷ 10,000 mL = 5 ug/mL
Practically speaking, we diluted our potentially 1:1 (100%) sample down into a 1:10,000 (0.01%) sample (a large dilution).
Continuing our example, let's say we ran this diluted preparation through the analyzing instrument and received a result of 5.5 ug/mL. We would have to "un-dilute" the results in order to get back to our initial baseline and desired unit of measurement. To "un-dilute" the results we take the result multiplied by the dilution ratio of 10,000 divided by our initial input of 0.05 g:
5.5 ug/mL · 10,000 ml ÷ 0.05 g = 1,100,000 ug/g
Since there are 1,000,000 micrograms (ug) per gram (g), 1,100,000 ug/g equates to 110%:
1,100,000 ug/g ÷ 1,00,000 ug/g · 100% = 110%
Now, you might be clamoring that this elaborate explanation still doesn't explain how or why the instrument would output an above 100% reading. And you're right.
A realization we had is that any laboratory measurement has uncertainty built-in, hence the method uncertainty and confidence interval. While balances are calibrated daily with standard weights, volumetric glassware markings are standardized, and pipettes are checked and documented, there are inherent discrepancies, however minuscule, introduced via human interaction, the lab environment, instrument calibration, etc. especially when dilution (use of a pipette) is required.
Because of these inherent discrepancies labs will provide a method uncertainty in the form of a confidence interval. In essence, based upon the previous analyzations done on certified standard samples we have the following historical recovery data (mean recovery is inferred from provided data):
- Relative Standard Deviation (RSD): 6%
- 95% Confidence Interval Range (95% CI): 91 - 115%
- Mean Recovery: 103%
- Mean Recovery is calculated by taking the minimum 95% CI + 2RSD = 91% + 2 · 6% = 103%
The above data shows that 95% of the time the lab analyzes a 99.9% ±0.1% certified standard sample of vitamin k2 mk-4, the recovery result will fall between 91 - 115%.
In our opinion, the main takeaway is: as long as our sample recovers at a similar percentage to the 99.9% ±0.1% certified standard sample on a calibrated instrument and both tests were run on the same day, by the same person using the same instrument and technique (which is what we're told happened), then we can be reasonably confident that the 2 samples are highly similar.
We hope this is a sufficient explanation of how the results could turn out this way. If you think otherwise, please send us a message!
[go back up]
